Reading Peptide HPLC Reports: Purity Verification (2026)

Independent analysis confirms that nearly 30% of peptide samples procured from non-verified sources contain significant contamination or incorrect dosing. In a high-stakes laboratory environment, blind trust in a vendor is a liability. Precision. Verification. Security. Understanding how to read a peptide HPLC report is the only definitive method to bridge the gap between a digital document and chemical reality. Many researchers struggle with the ambiguity of vendor-provided documentation and the fear of compromising sensitive assays with sub-standard reagents.
This article provides the analytical tools required to master the technical nuances of HPLC chromatograms. We will navigate the deep currents of retention times, baseline noise, and integration parameters to ensure your compounds, such as Retatrutide Research Peptide, meet the 99% purity standards required for scientific excellence. You will learn to audit a Certificate of Analysis with clinical authority, identifying the red flags that signal sub-standard reagents. We examine the 2026 EMA reporting thresholds and the specific data points necessary to confirm molecular integrity before your research begins.
Key Takeaways
- Establish the critical distinction between quantifying purity via HPLC and confirming molecular identity through mass spectrometry for comprehensive verification.
- Master how to read a peptide HPLC report by analyzing integration parameters and the relationship between the main peak and baseline noise.
- Differentiate between peptidic purity and Net Peptide Content (NPC) to accurately account for moisture and residual salts in your research reagents.
- Identify analytical artifacts and COA red flags, such as missing injection timestamps, that signal potential data manipulation or sub-standard reagents.
- Utilize raw chromatogram data to verify that research compounds meet the ≥99% purity threshold required for high-stakes laboratory precision.
The Role of HPLC in Research Peptide Quality Control
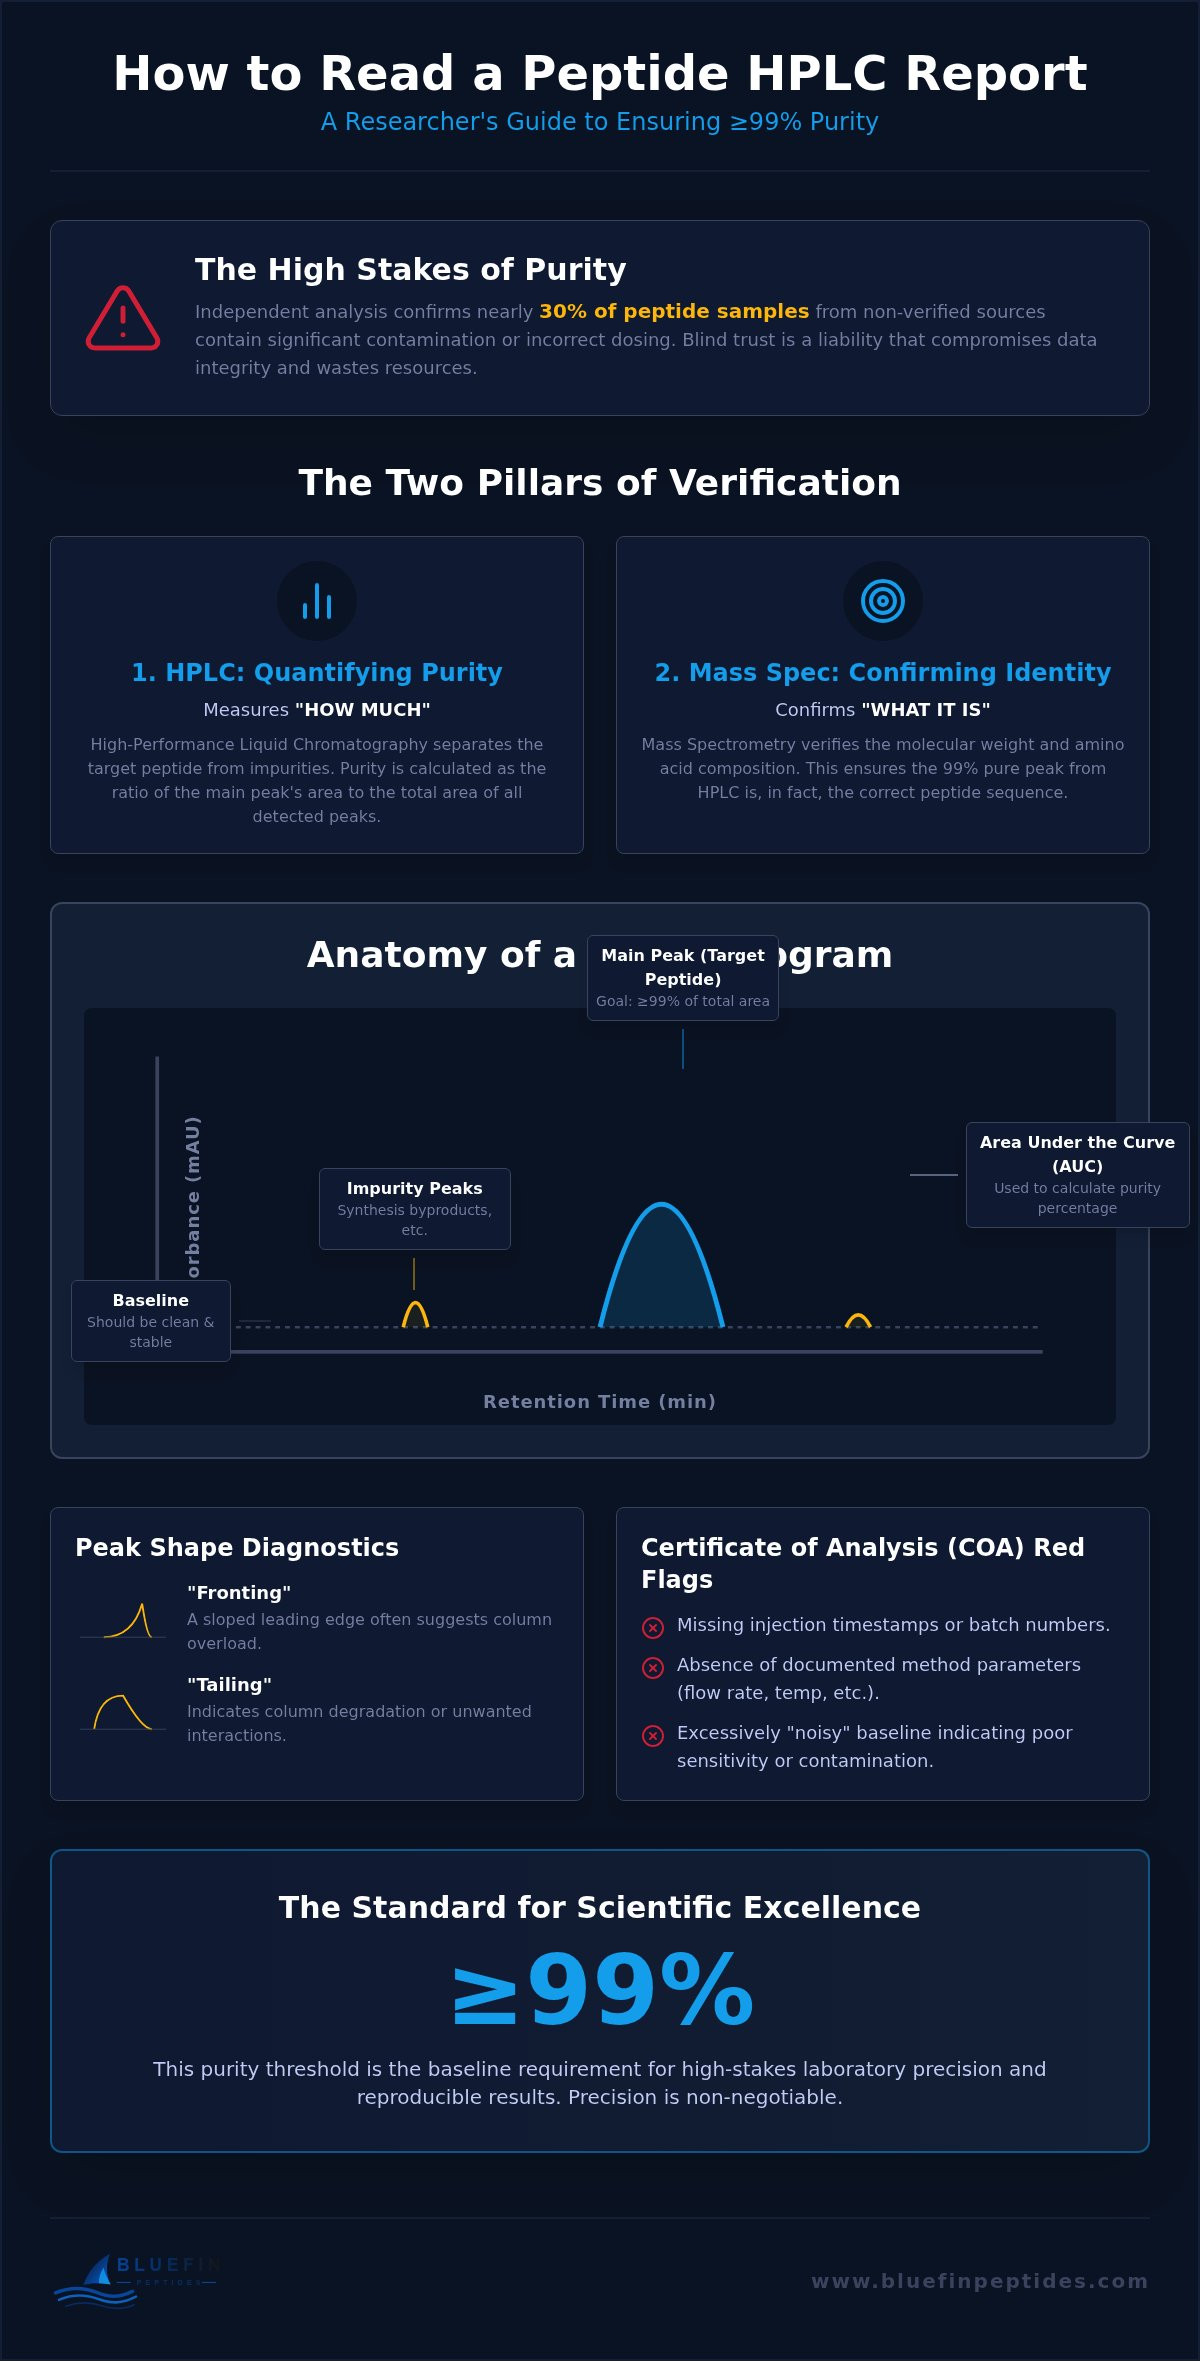
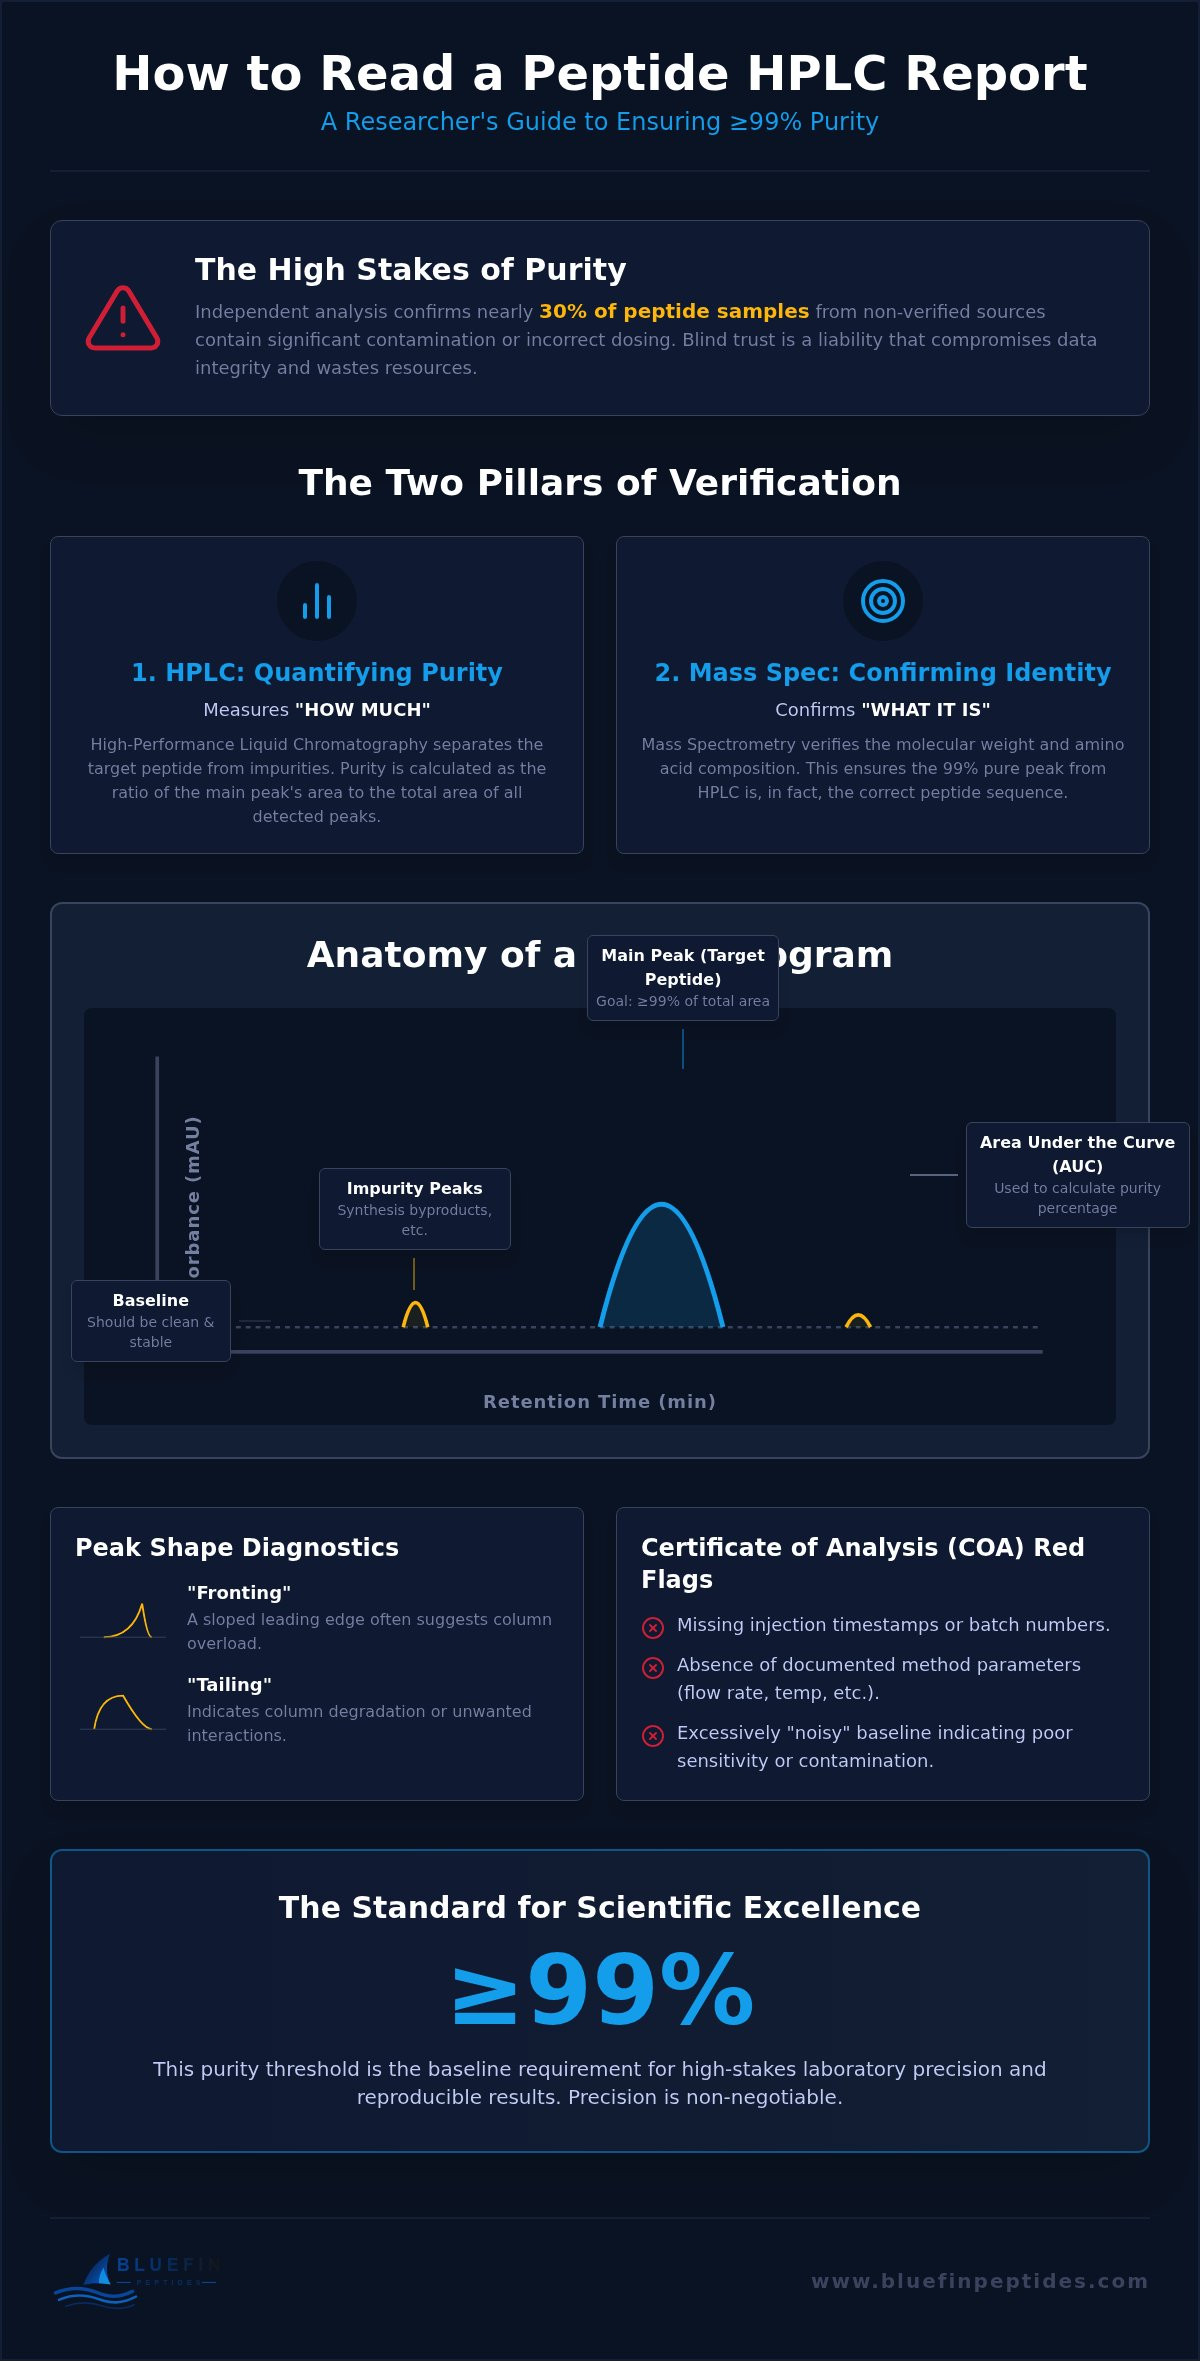
High-performance liquid chromatography (HPLC) is the definitive analytical technique for determining the purity of synthetic peptides. It operates as a mechanical filter. The process utilizes a high-pressure mobile phase to drive a dissolved sample through a stationary phase, typically a C18 silica column. This separation relies on the differential affinity of molecules for the column material. Byproducts of synthesis, such as truncated sequences or residual salts, elute at different times than the target peptide. This allows for the precise quantification of the primary compound relative to its impurities. Learning how to read a peptide HPLC report begins with recognizing that the resulting chromatogram is a visual representation of this separation process. It's a map of chemical purity.
Purity vs. Identity: A Critical Distinction
HPLC measures the concentration of the target molecule relative to other UV-absorbing materials, but it cannot confirm the specific chemical identity of the substance. This creates a dangerous vulnerability in laboratory procurement. A chromatogram may display a single, sharp peak indicating 99% purity, yet that peak could represent an entirely different sequence if the synthesis was flawed. Verification requires mass spectrometry (MS) to confirm molecular weight and amino acid composition. The two methods form an essential analytical duo. One measures the "what," and the other measures the "how much." HPLC purity is defined as the ratio of the target peak area to the total integrated area of all detected peaks.
The High Stakes of Laboratory Precision
Experimental reproducibility depends on chemical consistency. Impurities, specifically deletion sequences where a single amino acid is missing, can act as competitive inhibitors in receptor binding assays. These contaminants compromise data integrity and lead to false positives or negatives in sensitive models. Maintaining the fluid precision of a laboratory environment requires rigorous adherence to analytical quality standards for research peptides. For compounds like Retatrutide Research Peptide or Tirzepatide Research Peptide, a purity level of ≥99% is the baseline requirement. Sub-standard reagents introduce uncontrolled variables that obscure biological results and waste institutional resources. Precision is non-negotiable. We prioritize raw data transparency to ensure your research remains anchored in verifiable facts.
Anatomy of a Chromatogram: Deciphering the Visual Data
A chromatogram is a time-resolved map of chemical components. Understanding how to read a peptide HPLC report requires looking beyond the most prominent peaks to the underlying data structure. The X-axis represents Retention Time (Rt), measured in minutes. This value tracks the duration from the initial injection to the moment the compound passes the detector. The Y-axis measures Absorbance, typically expressed in Milli-Absorbance Units (mAU). While a tall peak suggests a high concentration, the height is secondary to the Area Under the Curve (AUC). Software integration calculates the AUC to determine the exact percentage of the target compound relative to the total detected signal. For analogues like Retatrutide Research Peptide, the Rt serves as a secondary confirmation of identity when compared against a known standard.
Retention Time and Peak Integration
Hydrophobicity dictates the Retention Time. Peptides with higher lipophilicity interact more strongly with the stationary phase, eluting later in the run. Peak integration is the process where the software identifies the start and end of a signal to calculate its area. You must inspect these integration markers. If the baseline is "noisy," it indicates low detector sensitivity or potential column contamination. Peak shape provides diagnostic value. "Fronting," characterized by a sloped leading edge, often suggests column overload. Conversely, "tailing" indicates column degradation or unwanted secondary interactions between the peptide and the silica matrix. Precise integration is the only way to ensure the reported 99% purity isn't masking smaller, hidden impurities.
Method Notes: The Context of the Trace
A chromatogram lacks meaning without documented method parameters. The reliability of the reported Rt is anchored by the flow rate, temperature, and mobile phase gradient. Most high-purity research peptides are analyzed using a C18 reverse-phase column. Detection typically occurs at 214nm or 220nm, which are the optimal wavelengths for the peptide bond. If these parameters aren't explicitly stated, the data cannot be verified. You can find these technical specifics and raw integration data included with every Bluefin Peptides research compound to ensure full analytical transparency. Standardizing these variables allows for the batch-to-batch consistency required in high-performance laboratory environments.
Purity vs. Net Peptide Content: Avoiding Common Interpretive Errors
Analytical precision requires a disciplined distinction between chemical purity and physical composition. Understanding how to read a peptide HPLC report involves more than identifying a single peak. Purity, expressed as an area percentage, refers strictly to the fraction of UV-absorbing peptidic material that matches the target sequence. It does not account for the total weight of the lyophilized powder. While a chromatogram may confirm 99% purity, the actual peptidic mass in the vial often ranges between 70% and 85%. The remaining mass consists of residual water and counter-ions. This delta is a standard byproduct of the synthesis and purification process. It's not an indication of failure but a metric of composition. Confusing these two values leads to significant errors in molar concentration and experimental dosing.
The Impact of Lyophilization on Mass
Lyophilization is the final stage of peptide stabilization. This freeze-drying process removes most solvents but leaves behind a matrix of non-peptidic components. The weight you measure on a laboratory balance is the sum of the peptide, residual moisture, and the counter-ion salt. Purity metrics are blind to these elements because they don't absorb UV light at the standard 214nm wavelength. To calculate the actual peptidic mass for precise reconstitution, you must utilize the Net Peptide Content (NPC) provided in the batch-specific documentation. Precision requires this calculation. Ignoring the NPC means your final solution could be 20% less concentrated than intended. This discrepancy compromises the depth and reliability of your receptor binding data.
Counter-Ion Considerations in Research
Counter-ions are essential for stabilizing the charged amino acid chains. Trifluoroacetic acid (TFA) is the standard mobile phase additive used during HPLC purification. Consequently, most research peptides are provided as TFA salts. While TFA is suitable for many laboratory models, its presence can affect certain sensitive assays or cell cultures. In these specific environments, researchers may require acetate or HCl salts to maintain the integrity of the biological model. You can examine the Tirzepatide research peptide purity standards for concrete examples of how NPC and counter-ion type influence final specifications. Mastering how to read a peptide HPLC report means verifying the salt form to ensure it aligns with your specific experimental parameters. Anchoring your research in these analytical details prevents the drift of variables that can sink a multi-month study.
Auditing a Certificate of Analysis (COA): Detection of Analytical Artifacts
A Certificate of Analysis (COA) is more than a summary table. It's a technical declaration of batch integrity. Mastering how to read a peptide HPLC report requires a disciplined eye for analytical artifacts that may obscure the true state of the compound. Trust is built on raw, unedited data. You must evaluate the report for specific markers of manipulation or technical failure:
- Smoothed Baselines: While visually appealing, excessive smoothing can mask small impurity peaks or noise that indicates a compromised run.
- Missing Injection Data: Authentic reports should display injection dates and timestamps. Missing data suggests the use of "representative" rather than batch-specific reports.
- Inconsistent Documentation: Mismatched fonts or alignment within the COA are immediate indicators of manual report manipulation.
Artifact peaks represent another layer of complexity. These "ghost peaks" often stem from solvent impurities or column bleed rather than the peptide itself. A professional laboratory specialist must distinguish these from actual peptidic contaminants. A clean, flat baseline is the anchor of a reliable integration. If the baseline slopes significantly or shows erratic fluctuations, the resulting purity percentage is mathematically suspect. We prioritize providing full transparency to ensure you can audit every peak with clinical precision.
Identifying Deletion and Truncated Sequences
Not all impurities appear as isolated signals. Small "shoulder peaks" that cling to the main signal often indicate closely related peptidic impurities, such as deletion sequences. These (n-1) sequences occur when a single amino acid fails to attach during synthesis. Because their chemical properties are nearly identical to the target, high-resolution HPLC is required to achieve separation. A shoulder on the main peak often indicates a missing amino acid in the sequence. Without high-resolution equipment and optimized gradients, these contaminants remain hidden within the primary peak, falsely inflating the reported purity. Identifying these subtle deviations is essential for maintaining the fidelity of your research models.
The Verification Protocol for Researchers
A comprehensive audit requires cross-referencing. You must compare the HPLC chromatogram with the corresponding Mass Spectrometry (MS) data to ensure the peaks represent the correct molecular weight. Check the "Date of Analysis" against your receipt date. Freshness is a metric of stability. Peptides can undergo degradation if stored improperly, making recent testing a requirement for high-stakes assays. Ensure the report reflects the exact batch and catalog number for Retatrutide research peptide to guarantee the data matches the physical vial. For guaranteed analytical transparency and batch-specific documentation, procure verified research compounds from Bluefin Peptides. This multi-level verification protocol is the key to how to read a peptide HPLC report effectively and prevents the use of sub-standard reagents that could sink your experimental results.
Bluefin Standards: Batch-Specific Verification for Laboratory Integrity
Analytical verification is the anchor of institutional trust. Bluefin Peptides operates as a disciplined logistics specialist, prioritizing the raw data required for high-stakes laboratory research. We mandate a baseline of ≥99% purity for all research compounds, a standard enforced through rigorous C18 reverse-phase HPLC. Unlike vendors that provide simplified summary tables, we provide researchers with the full, raw chromatogram data. This level of transparency is essential. Mastering how to read a peptide HPLC report becomes an empirical exercise when you can inspect the actual baseline noise, integration markers, and peak symmetry of your specific batch. We don't ask for trust; we provide the tools for verification.
Our Analytical Workflow
The transition from chemical synthesis to laboratory bench follows a methodical sequence. Every compound moves through synthesis, purification, and lyophilization before entering the stage of analytical verification. We utilize independent third-party testing to ensure an unbiased confirmation of both purity and molecular identity. This process ensures the fluid movement of data from the detector to the researcher. Each batch is treated as a unique chemical event, accompanied by a batch-specific Certificate of Analysis. This workflow eliminates the ambiguity of "representative" reports. It guarantees that the data you review reflects the exact physical state of the peptide in your vial. Our commitment to this protocol ensures that your experimental models are never compromised by analytical drift or unverified reagents.
Securing Your Research Supply Chain
Logistical speed is a requirement for maintaining chemical stability. Peptides are susceptible to thermal degradation and environmental stress during extended transit. By stocking and shipping all compounds from within the United States, we minimize exposure and ensure rapid fulfillment. This domestic advantage is paired with analytical depth. For instance, complex formulations like the GHK-Cu BPC-157 TB-500 research blend require sophisticated multi-peak verification. Each component must be resolved and quantified independently to ensure the integrity of the total blend. How to read a peptide HPLC report for a multi-peptide blend involves identifying each distinct signal and verifying its individual area percentage. Researchers can access these batch-specific COAs directly through our secure procurement portal. Precision in logistics and precision in data are the twin pillars of our service. Procure HPLC-Verified Research Peptides to anchor your next study in verifiable purity.
Securing Empirical Integrity in Peptide Research
Analytical transparency is the only defense against experimental drift. Mastering how to read a peptide HPLC report transforms a static document into a vital tool for laboratory security. By distinguishing between peptidic purity and Net Peptide Content, and identifying the subtle artifacts of data manipulation, you protect the fidelity of your research models. Verification is a disciplined habit. It ensures that every sequence performs with the precision your assays demand.
Bluefin Peptides serves as your high-performance laboratory partner. We provide the raw data required for absolute confidence. Every batch arrives with ≥99% HPLC-verified purity guaranteed and batch-specific Mass-Spec confirmation included. Our fast domestic shipping from the United States ensures your compounds remain stable throughout the logistics chain. Don't settle for representative data when your research requires batch-level precision.
Procure HPLC-Verified Research Peptides from Bluefin Peptides
Anchor your next study in verifiable facts and advance your research with unwavering confidence.
Frequently Asked Questions
What does "99% Purity" actually mean on an HPLC report?
This value represents the area percentage of the target peptide peak relative to the total integrated area of all UV-absorbing peaks detected during the run. It's a measure of chemical homogeneity within the peptidic fraction of the sample. It doesn't indicate that the vial contains 99% peptide by weight, as non-absorbing components like residual salts and moisture are excluded from this specific calculation. Precision in integration is required to confirm this homogeneity.
Can a peptide have 99% purity but be the wrong sequence?
Yes. HPLC identifies purity based on UV absorbance at specific wavelengths, not molecular sequence. A single sharp peak confirms that 99% of the material is a single substance, but it doesn't verify that the substance is the intended peptide. This is why mass spectrometry (MS) is an essential requirement. MS confirms the molecular weight matches the theoretical value, while HPLC confirms the high purity of that specific confirmed mass.
Why is the retention time different across different HPLC reports?
Retention time (Rt) isn't an absolute constant. It's highly sensitive to specific method parameters including column temperature, flow rate, mobile phase gradient, and the stationary phase used. Even minor variations in the percentage of acetonitrile can shift the Rt significantly. When learning how to read a peptide HPLC report, you must compare the Rt against a standard run on the same equipment under identical conditions to ensure batch-to-batch consistency.
What are deletion sequences and how do they appear on a chromatogram?
Deletion sequences occur when one or more amino acids fail to couple during the synthesis process. These impurities often possess very similar hydrophobicity to the target peptide, making them difficult to separate. On a chromatogram, they typically appear as "shoulder peaks" or small, unresolved signals immediately adjacent to the primary peak. Identifying these requires high-resolution columns and shallow gradients to prevent the impurity from being integrated into the main peak area.
Does the HPLC report account for the weight of the water in the vial?
No. HPLC detectors, typically set at 214nm or 220nm, don't detect water or residual salts like TFA. These non-peptidic components contribute to the total mass of the lyophilized powder but remain invisible on the chromatogram. To determine the actual amount of peptide, you must refer to the Net Peptide Content (NPC) value. This distinction is vital for researchers who require precise molar concentrations for their sensitive receptor binding assays.
What is the difference between a main peak and a shoulder peak?
The main peak represents the primary compound of interest, such as Retatrutide Research Peptide. A shoulder peak is a smaller signal that partially overlaps with the main peak's leading or trailing edge. This lack of baseline separation indicates the presence of a closely related impurity, often a truncated sequence from the synthesis process. In a high-purity report, the main peak should be symmetrical and fully resolved from any secondary signals.
Why is TFA mentioned in the method notes of my HPLC report?
Trifluoroacetic acid (TFA) is a standard ion-pairing agent used in reverse-phase HPLC to improve peak shape and resolution. It neutralizes the positive charges on the peptide chain to ensure sharp, symmetrical signals. Its inclusion in the method notes provides the technical context necessary for reproducibility. Understanding these specific additives is part of how to read a peptide HPLC report with professional authority. TFA also remains as a counter-ion in the final product.
How can I tell if an HPLC report has been manipulated or faked?
Audit the document for red flags like inconsistent fonts, missing injection timestamps, or perfectly "flat" baselines that show no electronic noise. Legitimate reports include raw integration tables that correspond exactly to the visual peaks. If the report lacks a specific batch number or the date of analysis is missing, it's likely a "representative" report rather than a batch-specific verification. Bluefin Peptides provides raw, unedited data to ensure absolute analytical transparency.
For laboratory research use only. Not for human or veterinary use. This content is educational and does not constitute medical, dosing, or usage guidance.
Browse the BLUEFIN catalog