Interpreting HPLC Peptide Reports: A Researcher's Guide
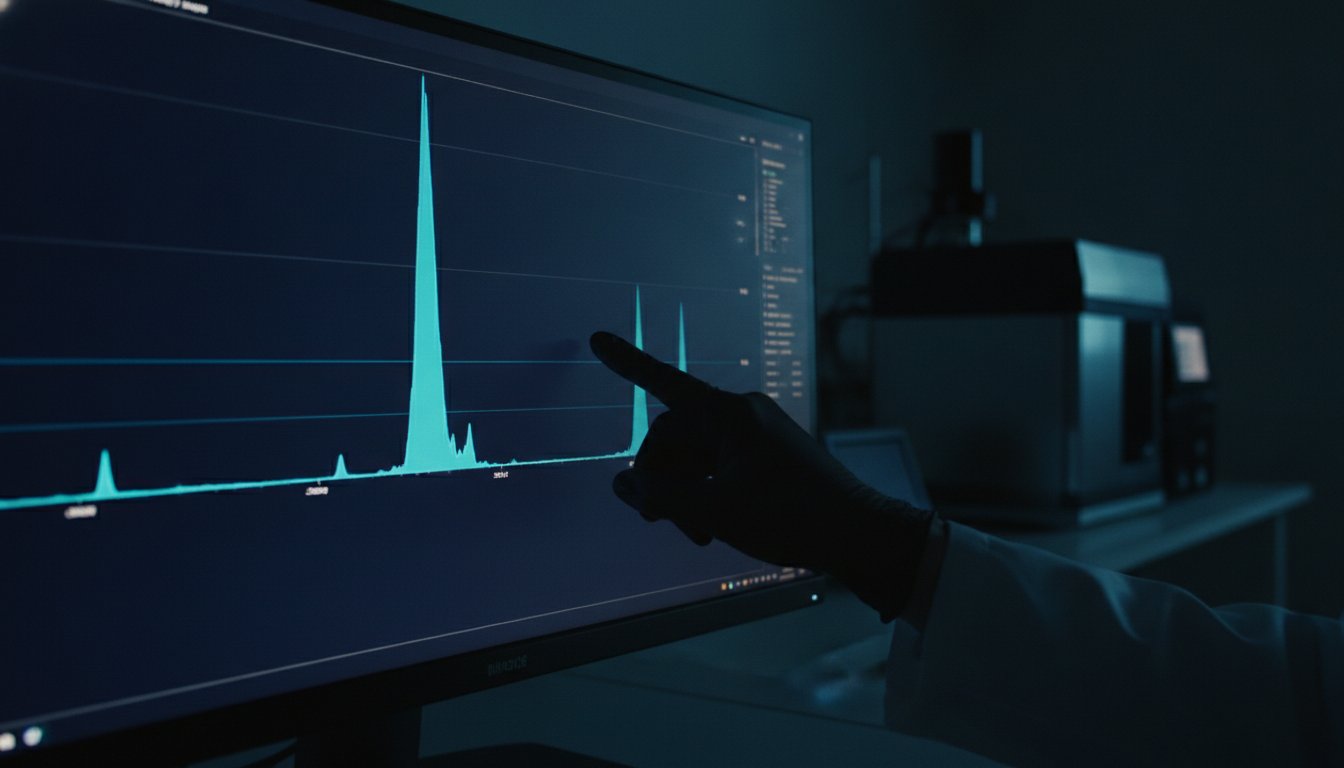
Analytical reports are the maritime charts of laboratory research. Precision in interpretation ensures your study doesn't run aground on impure data. A 99% purity label is merely a claim; a validated chromatogram is the technical proof. In the high-stakes environment of peptide synthesis, assuming a report is accurate without rigorous internal verification is a risk that can compromise your entire research model. Understanding how to interpret HPLC peptide report data is the only way to ensure your laboratory results are built on chemical integrity rather than vendor marketing.
You recognize the frustration of analyzing a complex array of peaks and wondering if a secondary shoulder indicates a synthesis failure or a harmless solvent artifact. It's a persistent challenge in a field where standardized protocols are often absent. This guide delivers the technical mastery needed to verify the purity and precision of your research peptides with clinical confidence. We will examine the mechanics of retention times, the calculation of area percentages, and the specific indicators that distinguish authentic analytical documentation from low-quality reports.
Key Takeaways
- Establish a baseline for research integrity by understanding how HPLC separates chemical components to prevent minor impurities from skewing cellular data.
- Master the navigation of the chromatogram by correlating Retention Time (tR) with UV absorbance (mAU) to identify the primary peptide peak.
- Gain technical proficiency in how to interpret HPLC peptide report data by identifying the 'Area %' within the integration results to calculate precise purity levels.
- Detect analytical red flags such as shoulder peaks or baseline broadening that indicate closely related isomers or peptide degradation.
- Validate your synthesis by cross-referencing HPLC purity peaks with Mass Spectrometry to confirm that the molecular weight aligns with the expected chemical profile.
Understanding the Role of HPLC in Peptide Purity Verification
High-Performance Liquid Chromatography (HPLC) serves as the primary analytical engine for separating, identifying, and quantifying each component within a chemical mixture. In peptide synthesis, it acts as a high-resolution lens. It isolates the target sequence from truncated sequences, deprotected fragments, and residual solvents. For the researcher, knowing how to interpret HPLC peptide report documentation is a fundamental requirement for experimental validity. Without this skill, you're navigating blind through data that may be skewed by synthesis byproducts.
Purity is not a decorative metric. It's a functional necessity. Minor impurities, even at concentrations below 2%, can alter cellular response in research models; this leads to non-reproducible results or unintended toxicity. These chemical currents can pull a study off course. Bluefin Peptides maintains a rigid standard. We mandate ≥99% purity for every research batch. This threshold ensures that the biological activity observed is solely attributable to the target peptide, such as our Retatrutide research peptide, rather than an unknown contaminant.
The Core Objective of HPLC Analysis
The primary goal is the quantification of the ratio between the target peptide and synthesis byproducts. Consistency is the priority. In longitudinal laboratory studies, even slight batch-to-batch variations can introduce variables that compromise the data set. HPLC provides the necessary resolution to navigate the chemical depths of a sample. It ensures research stability. By isolating the main peak from the baseline noise, the analyst confirms that the peptide's chemical composition remains within strict tolerances across all phases of the study.
HPLC vs. Mass Spectrometry: A Dual Verification
Analytical chemistry relies on two distinct pillars: purity and identity. HPLC measures how much of the target is present. It defines the purity. In contrast, Mass Spectrometry (MS) confirms what the substance is by measuring its molecular mass. An HPLC report provides the area percentage of the main peak, but it cannot verify if that peak is actually the intended molecule. A report is incomplete without both pillars. This dual verification prevents the misidentification of isomers or structurally similar contaminants. Learning how to interpret HPLC peptide report results alongside Mass Spec data provides a comprehensive shield against fraudulent or low-quality materials. Verification is the only path to laboratory security.
Decoding the Chromatogram: Identifying Peaks and Retention Times
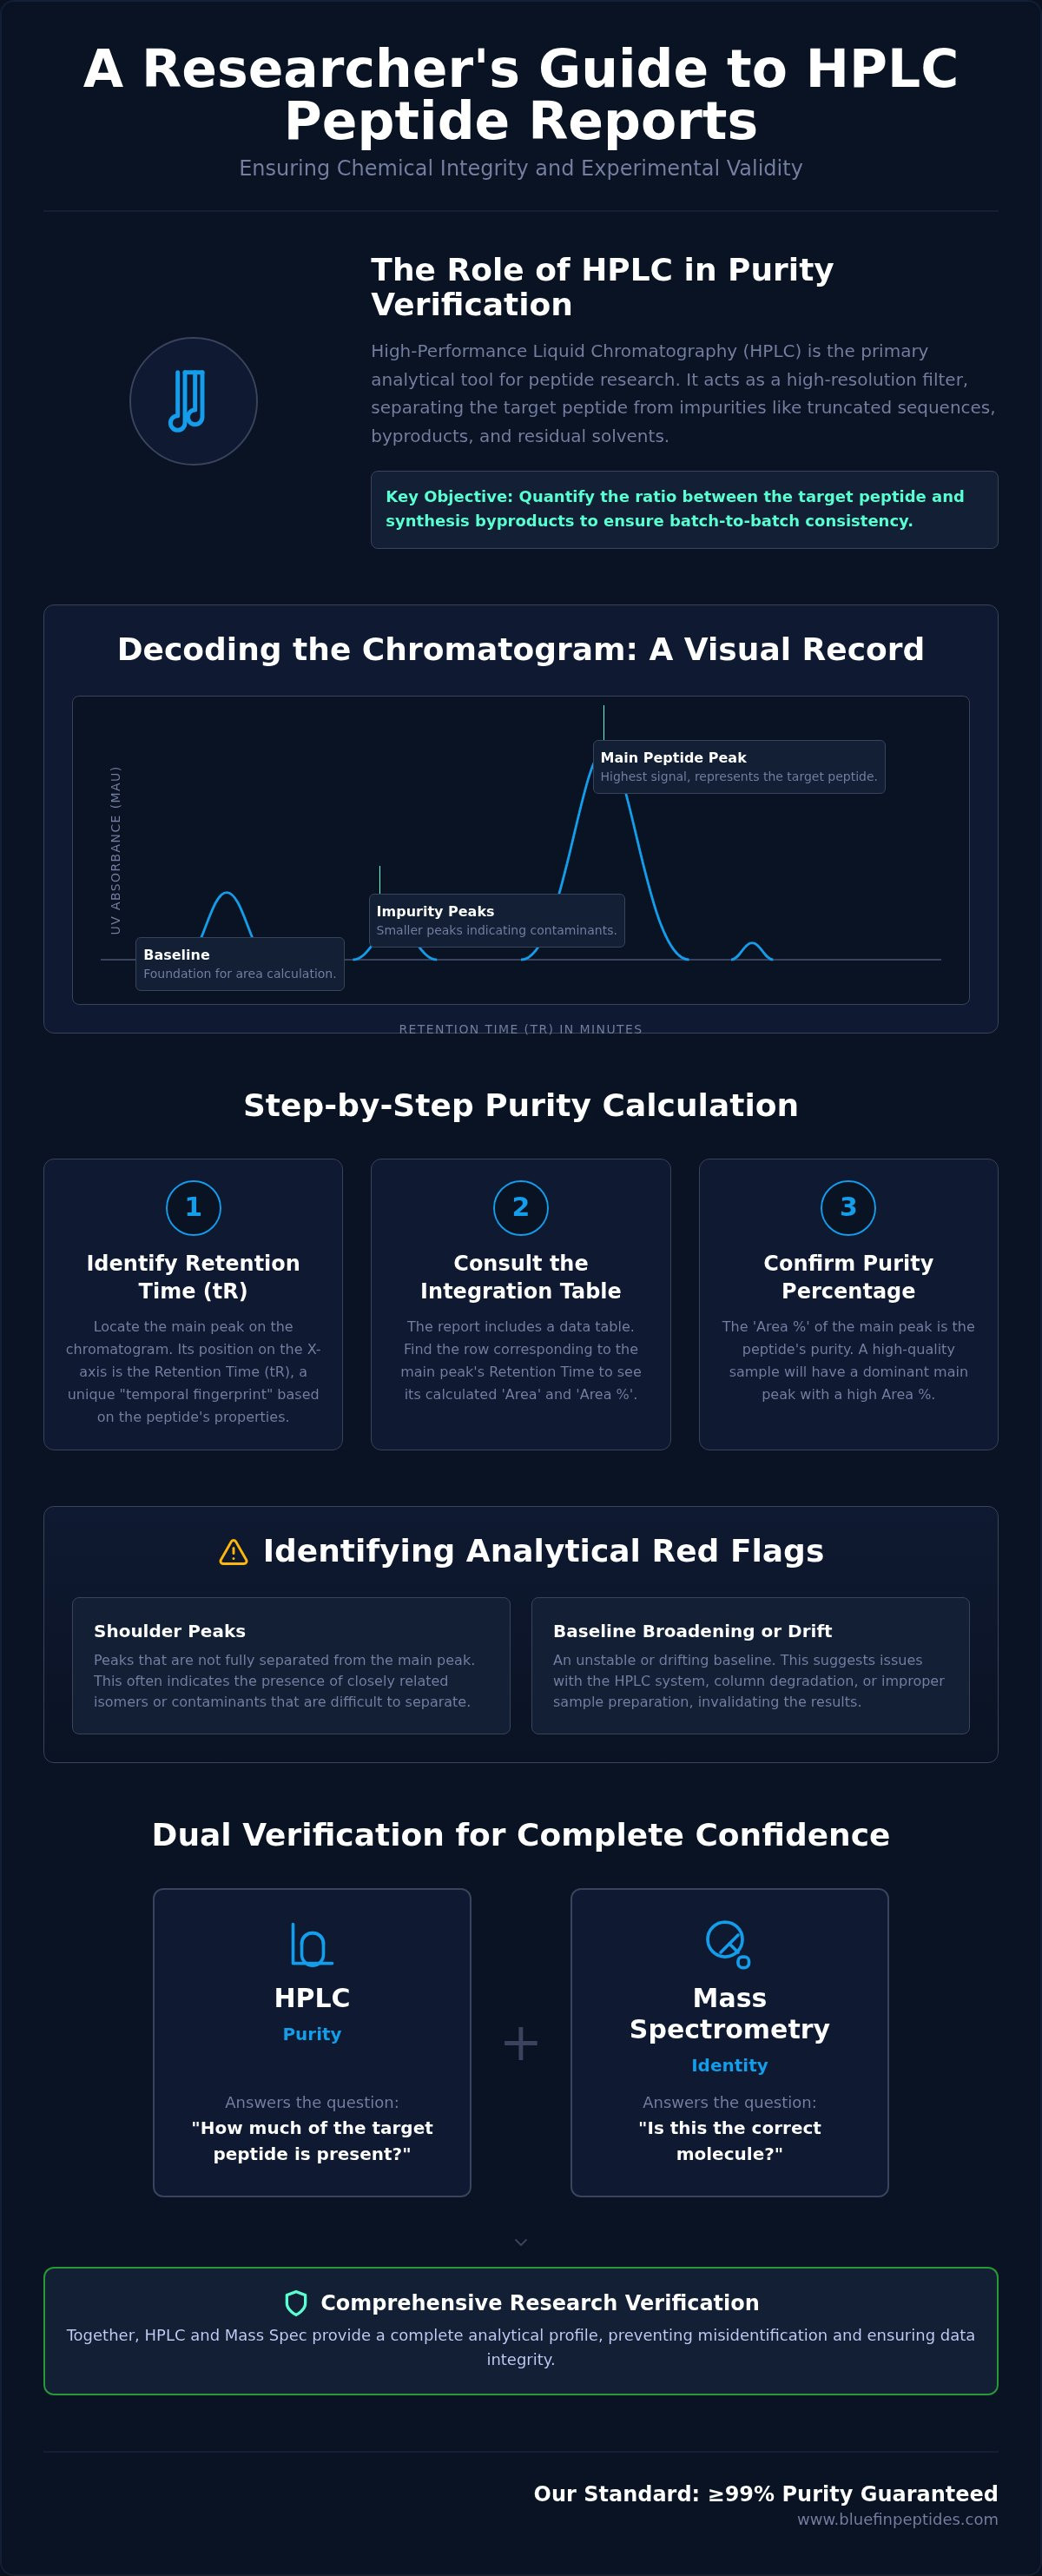
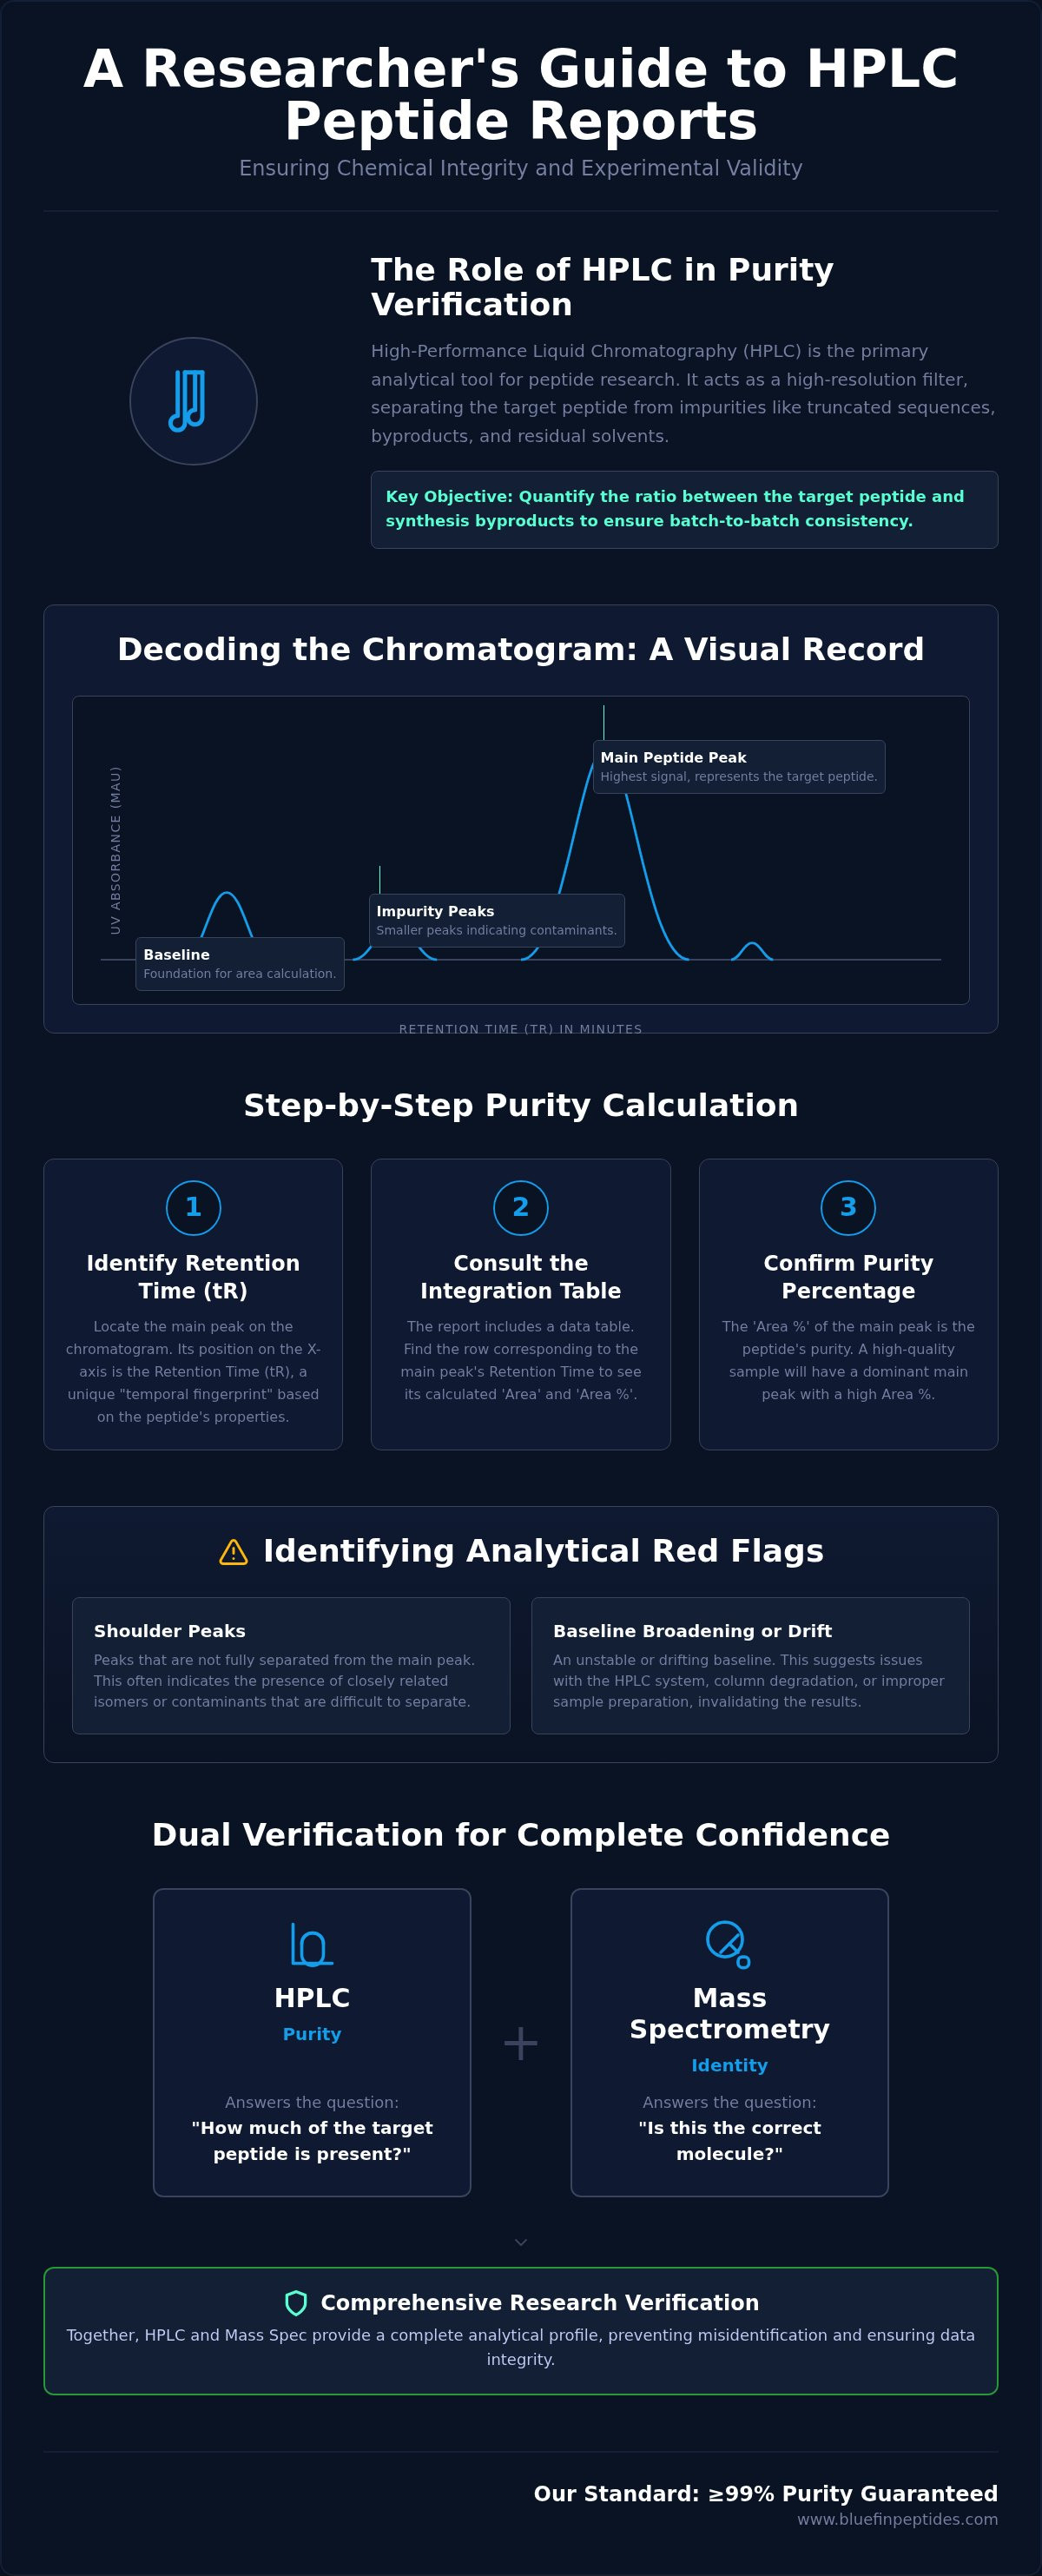
The chromatogram acts as a nautical chart, providing the visual record of a peptide's journey through the stationary phase. To understand how to interpret HPLC peptide report visuals, one must first master the coordinates of the graph. The X-axis represents Retention Time (tR), measured in minutes. This indicates the duration required for a specific component to elute from the column. The Y-axis measures UV absorbance, typically expressed in milli-Absorbance Units (mAU). This intensity reflects the concentration of the peptide as it passes the detector. Most peptide bonds are detected at 214 nm or 220 nm, where absorbance is highest.
The software performs integration by drawing a baseline beneath the peaks. This baseline establishes the mathematical foundation for calculating the area under the curve (AUC). If the baseline is improperly placed or "drifted," the resulting purity percentage is fundamentally invalid. Identifying the main peak requires locating the highest vertical signal, which represents the primary target peptide. Smaller peaks surrounding this central signal represent synthesis byproducts, truncated sequences, or residual impurities. Precision in integration is what separates a professional report from a generic summary.
The Significance of Retention Time
Retention Time is the temporal fingerprint of a molecule under specific conditions. It's a unique identifier based on the peptide's interaction with the mobile and stationary phases. Hydrophobicity is the primary driver in these chemical currents. Peptides with greater hydrophobic character adhere more strongly to the reverse-phase column, resulting in longer elution times. Consistency is the hallmark of quality. When analyzing multiple injections of the same batch, the tR must remain stable. Significant shifts in this value suggest equipment instability, changes in mobile phase composition, or chemical degradation within the sample. A stable tR ensures that the substance moving through the system is precisely what was intended.
Visualizing Impurities: Minor Peaks and Baselines
A high-purity peptide should produce a sharp, symmetrical peak. Peak sharpness serves as a proxy for chemical uniformity. In contrast, broad or "tailing" peaks often indicate poor column interaction or the presence of degraded fragments. Distinguishing between solvent noise and actual chemical impurities is a critical skill. Noise appears as erratic, low-amplitude fluctuations at the start of the run, often referred to as the "void volume." Actual impurities present as distinct, though smaller, peaks with measurable area. The baseline must remain flat and stable throughout the run to ensure that these minor peaks are correctly integrated into the final purity calculation. For researchers who require data that withstands rigorous scrutiny, Bluefin Peptides provides high-resolution chromatograms that clearly delineate the main peak from the baseline architecture.
Step-by-Step Calculation of Peptide Purity from HPLC Data
Once the visual chromatogram is reviewed, the focus must shift to the data matrix located below the graph. This section, typically labeled as the Peak Table or Integration Results, contains the quantitative raw data required to validate a vendor's claims. Learning how to interpret HPLC peptide report tables is essential for distinguishing between empirical data and marketing summaries. You must locate the column labeled 'Area %' or 'Purity %' and correlate it with the Retention Time (tR) identified as the target peptide in the previous section.
A common discrepancy occurs when the Peak Table reports 99% purity, but the chromatogram shows significant baseline noise or secondary peaks that haven't been integrated. You must ensure every visible peak above the noise threshold is accounted for in the total area sum. If the software has intentionally excluded a visible shoulder peak from the calculation, the reported purity is artificially inflated. Precision in research requires that the reported data matches the visual evidence without omission.
The Area Under the Curve (AUC) Method
The Area Under the Curve (AUC) method is the gold standard for quantification. Peak height is deceptive; it only measures the maximum concentration at a single point in time. AUC accounts for the entire elution profile. It captures the total quantity of the molecule passing the detector. To verify the calculation, divide the area of the main peak by the total sum of all integrated peaks, then multiply by 100. This percentage represents the relative purity of the sample. Understanding the integration limits set by the analyst is vital, as shifting these limits can hide minor impurities within the baseline.
Verifying Batch-Specific Data
Authenticity requires a direct link between the physical vial and the digital report. Cross-reference the batch number on the product label with the Certificate of Analysis (COA) header. Discrepancies here indicate a failure in logistical chain-of-custody. You must also check the Analysis Date. For 2026 laboratory standards, using data from a batch synthesized over twelve months prior is unacceptable due to potential peptide degradation. This level of scrutiny is standard for Research Peptides with Certificate of Analysis, where batch-specific transparency is the baseline. Relying on "representative" reports rather than batch-specific data is a risk that compromises the integrity of your research model.
Identifying Analytical Red Flags and Baseline Anomalies
Spotting anomalies in a chromatogram requires a disciplined eye for technical inconsistencies. When you analyze how to interpret HPLC peptide report visuals, you aren't just looking for a single peak; you're looking for the absence of navigational hazards. Deceptive data often hides in the baseline or the curvature of the main signal. Identifying these red flags early prevents the introduction of uncontrolled variables into your research models. Every deviation from a sharp, symmetrical peak suggests a compromise in chemical integrity.
Shoulder peaks are among the most common indicators of closely related impurities or isomers. These appear as small protrusions on the side of the main elution peak. They signify that the separation method was unable to fully isolate the target peptide from a structurally similar contaminant. Similarly, broadening peaks often indicate peptide degradation or poor interaction with the column stationary phase. If a peak loses its vertical sharpness and begins to spread horizontally, the concentration is no longer uniform. This lack of resolution makes accurate quantification impossible.
Baseline drift and ghost peaks represent systemic failures in the analytical run. A drifting baseline suggests instability in the mobile phase or thermal fluctuations within the column. This movement makes it impossible to draw an accurate baseline for integration. Ghost peaks are contaminants that appear from previous runs, often due to insufficient column washing. These echoes of past samples can artificially inflate the total area calculation, leading to an incorrect purity percentage. Researchers must demand a silent, flat baseline to ensure the signal-to-noise ratio is sufficient for reliable data.
When to Question a Purity Claim
Transparency is the only currency in laboratory research. You must reject representative reports that don't match the specific batch number of your shipment. Some vendors utilize manually adjusted baselines to hide minor peaks, a practice that artificially boosts the reported purity percentage. Another critical failure is the flat-top peak. This occurs when the detector is saturated, clipping the top of the signal. If the peak doesn't come to a natural, sharp point, the area under the curve is underrepresented, and the report is technically invalid.
Navigating the Baseline: Noise vs. Signal
Determining the Signal-to-Noise (S/N) ratio is the final step in validating minor peaks. For a 99% purity claim to be credible, the baseline must be nearly silent, with fluctuations significantly lower than any integrated impurity peak. If the noise level is high, small contaminants can easily be masked. A 'shoulder' on a main peak is an automatic red flag for research integrity. To ensure your laboratory work is supported by verified, high-resolution data, buy research peptides from a partner that prioritizes analytical transparency over marketing convenience.
Integrating HPLC and Mass Spec for Comprehensive Research Verification
Purity without identity is a scientific vacuum. While HPLC quantifies the ratio of components, it cannot definitively prove that the isolated peak is the intended molecule. True analytical security requires the integration of Mass Spectrometry (MS). This dual verification acts as a system of navigational redundancy. It ensures that the high-purity peak identified on the chromatogram corresponds precisely to the target peptide's molecular weight. For researchers, understanding how to interpret HPLC peptide report documentation is only the first step; you must also verify that the mass-to-charge ratio aligns with the theoretical profile of the compound.
This level of scrutiny is critical when validating complex analogues like the Retatrutide research peptide. Complex sequences are prone to synthesis errors that may not be visible on a standard chromatogram. A mislabeled or incorrectly synthesized compound can derail months of laboratory effort. Bluefin Peptides eliminates this risk by providing both HPLC and Mass Spec reports with every shipment. We provide the tools for verification because research integrity shouldn't rely on blind trust.
Identity Confirmation via Mass Spectrometry
Mass Spectrometry measures the mass-to-charge ratio of ions to determine the molecular weight of the sample. When reviewing the report, locate the M+H+ peak. This represents the parent molecule with a single proton attached. You must compare the theoretical molecular weight against the observed value. A discrepancy of more than a few Daltons suggests a synthesis failure or a different substance entirely. This process is detailed further in our guide on Mass Spec Peptide Verification. Identity confirmation is the final safeguard against chemical misidentification.
The Gold Standard for Laboratory Procurement
In the 2026 research landscape, analytical transparency is the primary differentiator between reliable partners and simple retail vendors. Researchers must compare research peptide suppliers based on their willingness to provide batch-specific, verifiable data. Relying on ISO-certified testing facilities and the latest instrumentation, such as the Agilent 1290 Infinity III LC, ensures that the data you receive meets modern standards for precision. Verification is the baseline. Security is the result. Secure your research model with Bluefin's verified standards and ensure your data is built on a foundation of chemical absolute. Master how to interpret HPLC peptide report data today to protect the future of your study.
Advancing Research Through Analytical Transparency
Precision in the laboratory depends on the ability to verify chemical purity at the batch level. By mastering how to interpret HPLC peptide report data, you transition from a passive consumer of vendor claims to an active validator of your own study's integrity. You now possess the technical framework to distinguish between sharp, symmetrical peaks and deceptive baseline anomalies that indicate degradation or synthesis failure. Integrating these chromatograms with Mass Spectrometry ensures that your research model is built on verified identity rather than assumption.
Security is found in documentation. Bluefin Peptides provides the analytical pillars necessary for rigorous science. We include batch-specific COAs with every order, featuring ≥99% Purity Guaranteed and Mass-Spec Identity Confirmation to ensure your results are reproducible and verifiable. Procure HPLC-Verified Research Peptides from Bluefin Peptides to secure your laboratory results against the currents of impure data. Your research deserves a foundation of absolute clarity.
Frequently Asked Questions
What is a good purity percentage for research peptides?
A purity of 98% or higher is the generally accepted standard in 2026 for research grade peptides. At Bluefin Peptides, we maintain a more rigorous threshold, mandating ≥99% purity for every batch. This level of refinement ensures that biological responses in your study aren't skewed by synthesis byproducts or residual reagents. Lower purity levels introduce uncontrolled variables that can compromise the validity of longitudinal data.
How do I know if the HPLC report is actually for the batch I received?
Verification requires a direct match between the batch number printed on the physical vial and the identification header on the Certificate of Analysis (COA). If the vendor provides a "representative" report without a specific batch identifier, the data is functionally irrelevant to your shipment. Legitimate laboratory partners ensure every shipment is accompanied by batch specific documentation to maintain a transparent chain of custody.
What does 'Retention Time' mean on a peptide COA?
Retention Time (tR) is the temporal fingerprint indicating how long a peptide interacts with the stationary phase before eluting. It's measured in minutes on the X-axis of the chromatogram. Stability in tR across multiple injections confirms the substance's chemical consistency. Significant deviations in this value often signal issues with the mobile phase, equipment calibration, or the physical state of the peptide itself.
Can an HPLC report be faked or manipulated?
Analytical reports can be manipulated through manual baseline adjustments that hide minor peaks or by reusing data from superior batches. Learning how to interpret HPLC peptide report visuals allows you to spot these red flags, such as "flat-top" peaks or inconsistent noise levels. Authentic reports should always feature high resolution graphics and clear integration tables that account for all visible signals above the baseline.
Why is Mass Spectrometry necessary if I already have an HPLC report?
HPLC only quantifies the purity of a substance; it doesn't confirm its chemical identity. Mass Spectrometry (MS) provides the molecular weight, verifying that the high purity peak identified in the HPLC run is actually the intended peptide sequence. Without MS, you risk receiving a mislabeled compound that appears pure but is structurally incorrect. Dual verification is the only path to absolute laboratory security.
What should I do if my peptide report shows a shoulder peak?
A shoulder peak is a technical red flag that warrants the rejection of a batch. It indicates that the target peptide is contaminated with closely related impurities or structural isomers that the column couldn't fully separate. These contaminants can interfere with cellular receptors and produce false positive results. High purity research requires a sharp, symmetrical peak that is clearly delineated from the baseline noise.
Does the HPLC report change if the peptide is reconstituted?
The HPLC report reflects the chemical state of the peptide at the time of synthesis and lyophilization. Once you reconstitute the peptide in a bacteriostatic or sterile diluent, the degradation process accelerates. The original report no longer accounts for the stability of the solution. Researchers must perform their own stability testing if the study requires long term storage of reconstituted compounds beyond the initial analysis.
How long is a peptide HPLC report valid for in 2026?
In current laboratory practice, an HPLC report is considered valid for 12 months, provided the lyophilized peptide is stored under optimal conditions, typically -20°C or -80°C. Beyond this period, the risk of primary sequence degradation increases. When you evaluate how to interpret HPLC peptide report dates, ensure the analysis was conducted recently to guarantee the chemical integrity of the batch matches the documented results.
For laboratory research use only. Not for human or veterinary use. This content is educational and does not constitute medical, dosing, or usage guidance.
Browse the BLUEFIN catalog