Detecting Peptide Aggregation: Methods, Evidence, and Limits

A clean purity result can still leave the aggregation question unanswered. Detecting peptide aggregation requires methods suited to the forms being investigated: soluble oligomers, larger assemblies, and subvisible particles may produce different analytical signals. A high-purity result alone is not direct evidence that a sample is free of aggregates.
Results can be difficult to compare when one assay is treated as a complete answer. Reliable interpretation starts with a defined question and complementary methods, not a single number.
This guide explains what peptide aggregates can look like, how techniques such as size-exclusion chromatography, dynamic light scattering, and particle imaging contribute evidence, and where each method has limits. You’ll learn how to select orthogonal assays for a research objective and interpret findings without overstating what they establish. We’ll also clarify how purity testing and other analytical documentation can support characterization without serving as aggregation-specific proof. The goal is a more complete picture, built from evidence interpreted in context.
Key Takeaways
- Distinguish soluble assemblies, larger particles, and fibrillar structures before selecting an assay.
- Approach detecting peptide aggregation by matching complementary methods to the species and sample state you need to assess.
- Compare assays by what they measure, their detection range, and the artifacts that may affect results.
- Use a defined workflow to separate initial screening from deeper characterization and document how conclusions were reached.
- Interpret batch documentation according to the methods reported; identity and purity results are not automatically aggregation measurements.
What peptide aggregation is, and why detection depends on the research question
Peptide aggregation is the association of peptide molecules into higher-order species. These species can remain dispersed in solution or grow into insoluble material; they are not one uniform category. An analytical method may detect changes in soluble molecular size while missing particles, or detect particles without establishing their molecular structure. A result is meaningful only in relation to what the method was designed to observe.
Aggregation can reduce sample homogeneity and complicate interpretation of concentration, identity, or activity measurements. It may also change during handling: pH, temperature, agitation, and freeze-thaw conditions can influence the physical state observed at the time of analysis. The broad concepts described in Protein aggregation provide useful background, but a peptide’s sequence, formulation, and experimental conditions determine which forms are relevant to a specific study.
Which forms of peptide aggregation can analytical methods encounter?
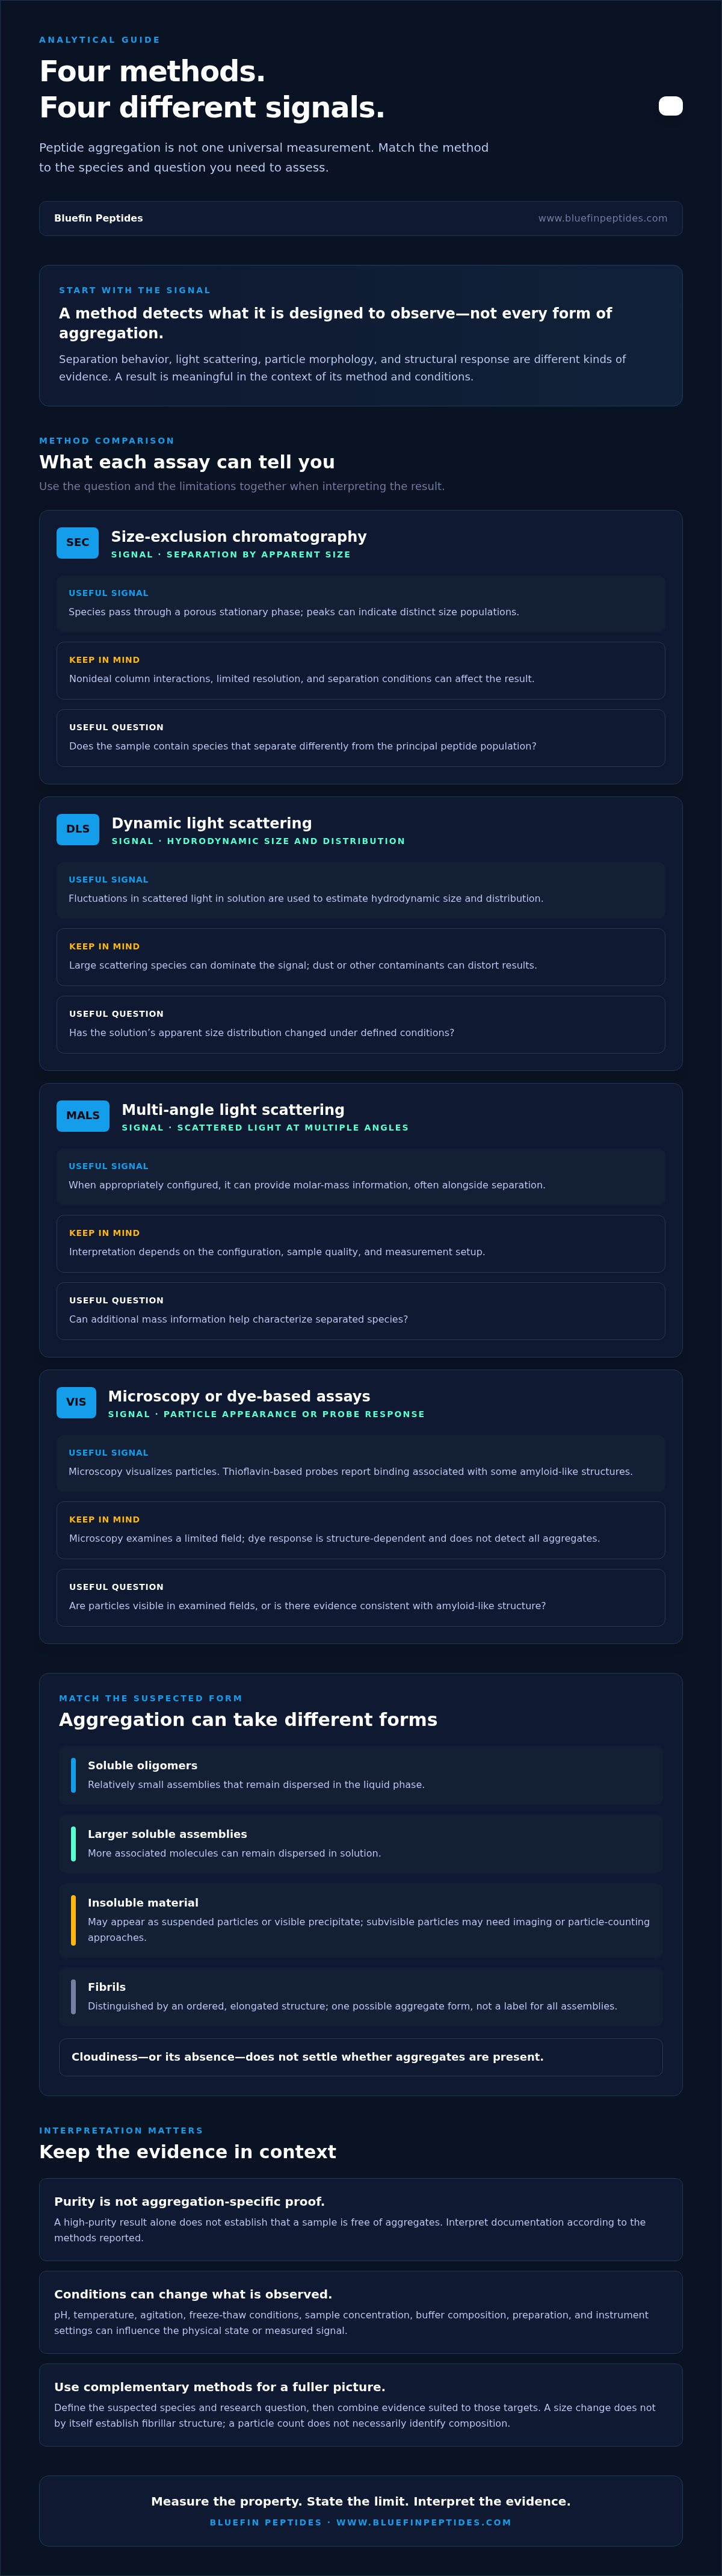
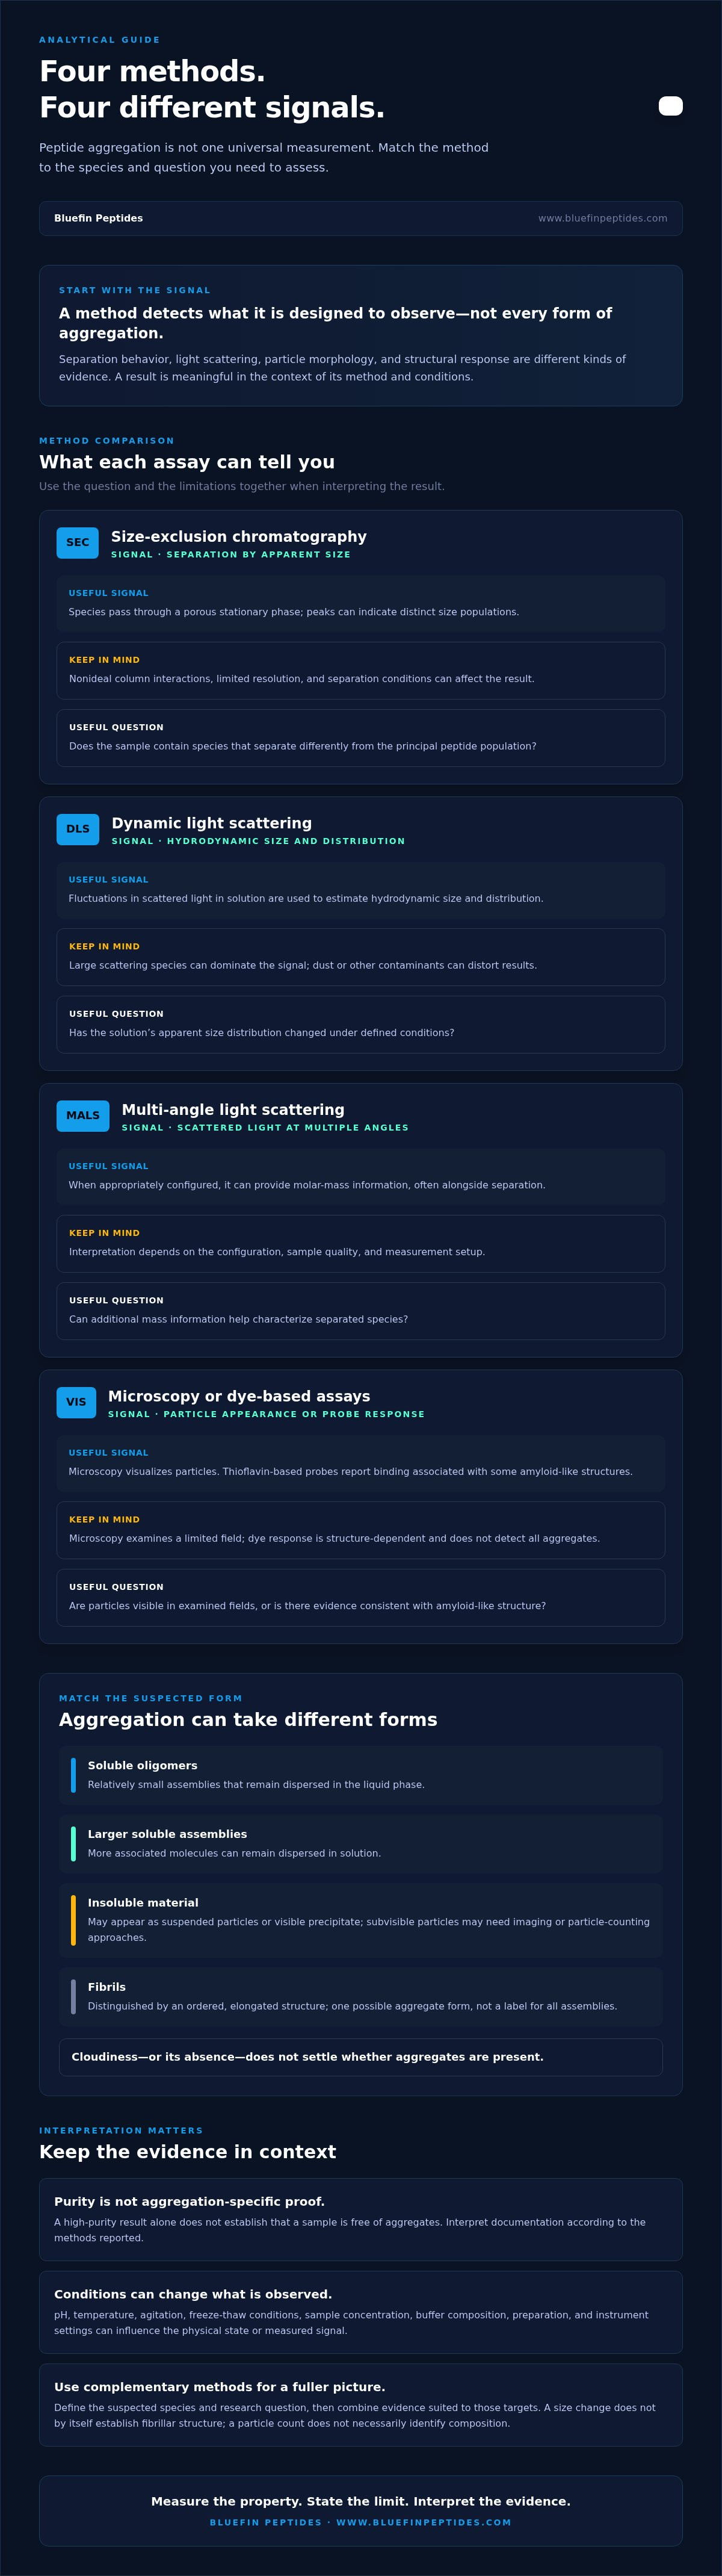
Soluble oligomers are relatively small assemblies that remain dispersed in the liquid phase. Larger soluble assemblies may contain more associated molecules, while insoluble material can appear as suspended particles or visible precipitate. These categories describe differences in size and physical state; they do not mean that every peptide follows the same pathway or forms every type.
Visibility is not a reliable boundary for detection. Visible precipitate differs from subvisible particles, which may require imaging or particle-counting approaches, and from soluble aggregates that remain in solution. Fibrils are distinguished by their ordered, elongated structure. They are one possible aggregate form, not a general label for all peptide assemblies. Identifying the suspected form helps narrow the appropriate measurement. Cloudiness, or its absence, does not settle the question.
Why a single aggregation result may not answer the whole question
Methods respond to different physical properties. A separation technique may distinguish species by how they behave in a column; light-scattering approaches respond to particle size and distribution; imaging methods can reveal particle morphology. Each signal has limits. A change in apparent size, for example, does not by itself establish a fibrillar structure, and a particle count does not necessarily identify a particle’s composition.
No single method detects every aggregate form equally. Sample concentration, buffer composition, temperature, preparation, and instrument settings can influence what is measured. An aggregate may also be altered by dilution or other steps used during analysis. Assay conditions are part of the evidence, not incidental details.
Before detecting peptide aggregation, define the suspected species, sample matrix, and research question. Is the aim to screen for a change in soluble assemblies, characterize visible or subvisible particles, or investigate fibril formation? A focused question guides method selection and keeps conclusions within the scope of the signal measured. Next, compare methods by their principles, useful outputs, and limitations.
How peptide aggregation detection methods measure different properties
Analytical methods do not measure “aggregation” as one universal quantity. They report a property: separation behavior, light scattering, particle morphology, or a structural change. The right method depends on whether the study is screening for a change, estimating size, or examining a particular aggregate structure. Use the comparison below to match the research question to the signal and its limits.
| Method | Principle and useful signal | Limitations | Suitable research question |
|---|---|---|---|
| Size-exclusion chromatography (SEC) | Separates species by apparent size as they pass through a porous stationary phase; peaks can indicate distinct size populations. | Column interactions may be nonideal, and limited resolution can blur species with similar behavior. Conditions can affect separation. | Does the sample contain species that separate differently from the principal peptide population? |
| Dynamic light scattering (DLS) | Measures fluctuations in scattered light in solution to estimate hydrodynamic size and distribution. | Large scattering species can dominate the signal; dust or other contaminants can distort results. | Has the solution’s apparent size distribution changed under defined conditions? |
| Multi-angle light scattering (MALS) | Measures scattered light at multiple angles and can provide molar-mass information when appropriately configured, often alongside separation. | Interpretation depends on configuration, sample quality, and the measurement setup. | Can additional mass information help characterize separated species? |
| Microscopy or dye-based assays | Microscopy visualizes particles; thioflavin-based probes report binding associated with some amyloid-like structures. | Microscopy samples a limited field; dye response is structure-dependent and does not detect all aggregates. | Are particles visible in examined fields, or is there evidence consistent with amyloid-like structure? |
What SEC, DLS, and light-scattering methods can indicate
SEC is a separation approach, not a direct image of molecular shape. Apparent size is inferred from how species elute relative to the column’s separation behavior. Peptide-column interactions, buffer composition, and resolution between neighboring peaks can affect interpretation, so report the conditions and consider them alongside the chromatogram. DLS measures in solution without separating species; a small number of larger scatterers may disproportionately influence its size estimate. MALS can add complementary mass information, but only when its configuration and data analysis suit the sample.
For pharmaceutical development, consult relevant FDA drug guidance resources for current guidance context. Guidance does not make a particular assay suitable for every peptide or research question.
When microscopy, spectroscopy, or dye-based assays add evidence
Microscopy can show particle shape and distribution in the fields examined, but those fields represent only part of the sample. Spectroscopic measurements can provide evidence of structural changes, while thioflavin-based assays respond to some amyloid-like structures. A positive signal is not a census of all aggregate forms, and a negative result does not rule them all out.
Assay signals reflect their measurement principle, not aggregation in the abstract. For sound interpretation, relate each readout to the sample state and method conditions, then select complementary evidence where the research question calls for it. Researchers sourcing qualified research-use peptides can review Bluefin research peptide offerings alongside the available batch documentation. HPLC verification and mass-spectrometry confirmation support analytical transparency, but do not directly establish aggregation status.
How to compare aggregation assays without mistaking purity for aggregate evidence
Results are comparable only when the methods address relevant properties under compatible conditions. For each assay, record what it measures, the species and size range it can detect, whether the sample is measured in solution or after separation, and which artifacts may affect the signal. A method that separates soluble species cannot automatically answer a question about suspended particles. A particle-sensitive readout, in turn, may not identify molecular composition.
There is no universal ranking of assays. Suitability depends on the target species, sample matrix, preparation, and method performance for its intended purpose. When detecting peptide aggregation, compare evidence by its scope rather than treating different outputs as interchangeable measurements of one quantity.
Why HPLC purity and mass spectrometry answer different questions
Chromatographic purity is a method-dependent profile of components detected under specific conditions. A reported purity estimate reflects the peaks and detector responses included in the analysis, not necessarily every species in the sample. Components may coelute, and differences in detector response can affect how peak areas represent the mixture. Column chemistry, mobile phase, detection settings, and sample preparation all shape the result.
Mass spectrometry can support molecular identity or mass assignment. On its own, however, it does not establish how much peptide is present as each aggregate form. A stated ≥99% HPLC-verified result, such as a purity specification, should therefore be read as evidence within the scope of that chromatographic method, not as a direct aggregation measurement. Mass confirmation adds a different kind of evidence; it does not fill every gap in aggregate detection.
How to interpret conflicting or inconclusive assay results
When two results disagree, first check whether they examined the same sample state and physical property. A separation measurement after dilution, for example, may not reflect the distribution in the original concentrated solution, while a particle method may not detect soluble oligomers. Differences may reflect distinct detection ranges rather than a true contradiction.
Review the practical details before drawing a conclusion:
- Sample handling: Compare preparation, dilution, temperature, storage, and time between sampling and measurement.
- Method sensitivity: Check whether the suspected species falls within the assay’s validated detection range and whether the signal is near its practical limit.
- Potential artifacts: Consider coelution, contaminants, nonspecific responses, and instrument or analysis settings relevant to each method.
- Reporting: State what each result supports, what it cannot establish, and which differences remain unresolved.
Do not force agreement by selecting the preferred result or averaging unlike measurements. If one assay indicates a change and another does not, report both with their conditions and limitations. This disciplined interpretation preserves the evidence trail and guides the next test without overstating what any single result proves.
A practical workflow for selecting and interpreting aggregation tests
A reliable test plan begins with the decision the results must support, not with a preferred instrument. Screening may be sufficient to flag a change in a defined sample; characterization requires evidence that describes the relevant species in more detail. The distinction depends on the study objective. For detecting peptide aggregation, use this workflow to keep the question, method, and conclusion aligned.
- Define the question. Specify what needs to be learned, such as whether a sample has changed during storage or whether a particular size or structural feature is present.
- Identify likely species. Use the sample’s history and observed state to identify whether soluble assemblies, suspended particles, visible precipitate, or a structural form are relevant.
- Select complementary methods. Match the measurement principle to the target. Add an orthogonal method when one signal cannot resolve the question, rather than repeating a measurement with the same blind spots.
- Interpret against controls. Use appropriate controls, replicates, and validated procedures for the method and study. Define these for the sample and objective; no universal experimental conditions suit every peptide or assay.
- Document the evidence. Record method conditions, sample state, observed signals, uncertainty, and the limits of the conclusion so another researcher can assess the interpretation.
Match the method to the sample and suspected aggregate
First record whether the sample is fully soluble, contains suspended particles, or shows visible precipitation. Then select methods based on the information needed: separation or size-sensitive analysis for changes in solution species, structural probes for specific structural evidence, or microscopy when visualizing particles is relevant. Choose assays for the species and property under investigation. Use orthogonal evidence when a single measurement leaves a meaningful gap.
Screening and characterization are not fixed labels for particular instruments. A rapid, fit-for-purpose screen may answer a narrow monitoring question, while characterization may require multiple methods and deeper interpretation. The same technique can serve either role depending on its validated performance and the decision the study needs to make.
Document results so another researcher can assess the evidence
A useful record identifies the method principle, sample state at measurement, preparation steps, relevant controls and replicates, and the criteria used to interpret the signal. Separate the observation from the inference: “a higher scattering signal was observed” reports a result, while “aggregation increased” is a conclusion that may require supporting evidence. State the method’s detection limits and relevant interpretation constraints.
Flag deviations from the procedure, uncertain findings, and discordant results rather than smoothing them into a single conclusion. This preserves the evidence trail and gives later work a clear basis for follow-up. For qualified research use, explore Bluefin’s research peptide offerings and their batch-level documentation as a resource for analytical transparency, not as aggregation-specific testing.
Use batch-level documentation as context, not proof of aggregation status
Batch-specific records help establish which material was tested and what the reported results support. Their value depends on the methods, sample, and findings stated in the documentation. A certificate of analysis (COA) can provide traceability and analytical context, but its title alone does not establish that aggregation was assessed. For detecting peptide aggregation, look for an aggregation-specific method and result before treating a document as evidence about aggregate status.
What a certificate of analysis can, and cannot, support
A COA is useful when it connects results to a particular batch and identifies the analyses performed. Reported identity or purity findings can support conclusions within the scope of those methods. They are not interchangeable with size, particle, or structural measurements designed to assess aggregation. If the document does not report an aggregation-specific method and result, do not infer that aggregation was tested or ruled out.
Bluefin Peptides states that its research peptides are ≥99% HPLC-verified, with mass-spectrometry confirmation and batch-specific COAs. These details support analytical transparency: HPLC results relate to a chromatographic profile, while mass spectrometry supports molecular mass confirmation. Neither directly establishes the sample’s aggregation status. Researchers reviewing analytical quality standards for research peptides should apply the same distinction, assessing what each stated method measures rather than extending a result beyond its scope.
Where supplier documentation fits into a laboratory workflow
Supplier records are one input to a research workflow, not a substitute for study-specific assessment. A laboratory may use documentation to identify the reported batch and understand its stated identity or purity results, then select additional analysis according to the sample state and research question. A purity profile, for example, does not answer whether soluble assemblies or particles are present unless the method and reported result specifically address those forms.
Keep the evidence trail clear by recording the batch identifier, the supplier-reported methods and results, and any additional tests performed within the study. Note which conclusions come from supplier documentation and which come from independent, question-specific analysis. This separation makes later comparisons more reliable and prevents identity, purity, and aggregation claims from becoming conflated. When reviewing documentation for a particular peptide, including retatrutide, interpret analytical specifications according to the methods and results reported for that material.
Bluefin’s research peptide offerings are intended exclusively for qualified research use and are not intended for human, veterinary, or consumer use. Qualified researchers seeking research peptides with batch-level documentation can explore the available offerings as part of a transparent, method-aware sourcing process.
Build a clearer evidence trail in your next study
Make the next step a decision about your study: define what change would matter, then establish how you’ll assess it before collecting data. A documented baseline and consistent handling plan can make later comparisons more interpretable, while keeping conclusions tied to evidence rather than assumptions. That discipline is central to detecting peptide aggregation responsibly.
Choose research materials with documentation that helps you understand what was tested, while keeping supplier records distinct from any aggregation-specific assessment your study requires. Bluefin Peptides provides research-use peptides with batch-specific certificates of analysis, HPLC verification, and mass-spectrometry confirmation. These details support transparency about reported analyses; they are not, by themselves, proof of aggregation status.
For qualified research use, review Bluefin Peptides’ research-use peptide catalog and consider how its batch documentation fits your analytical plan. Use the information to support a careful, well-defined study, with every conclusion anchored to the method that produced it.
Frequently Asked Questions
Can HPLC detect peptide aggregation?
Yes, HPLC can reveal aggregate-associated peaks when the method separates those species and the detector responds to them. For a practical check, compare chromatograms collected using the same method and review whether the injection and analysis cover the relevant sample components. A purity percentage alone may not account for coeluting species or material the method does not detect. Treat an HPLC result as aggregation evidence only when the method was designed and assessed to answer that question.
Which method is best for detecting peptide aggregation?
No single method is best for every research objective. SEC may help assess separated soluble species, while DLS can indicate changes in solution-phase scattering behavior. If the concern is fibrillar structure, a structural assay may be more relevant than a size measurement. Detecting peptide aggregation effectively means matching the assay to the suspected species and sample state, then adding complementary evidence if the first result leaves an important question unanswered.
Does dynamic light scattering detect all peptide aggregates?
No. DLS reports solution-phase scattering behavior and can be disproportionately influenced by a small amount of larger material, including dust or contaminants. A practical quality check is to compare replicate measurements and review the instrument’s quality indicators alongside the sample preparation record. Even a consistent size estimate does not identify aggregate structure or provide a complete inventory of species. Interpret the result within the method’s capabilities, not as proof that other forms are absent.
What is the difference between peptide aggregation and precipitation?
Aggregation describes peptide molecules associating into assemblies; precipitation describes insoluble material separating from solution. Aggregates can remain dispersed and invisible, while visible cloudiness or sediment may have causes other than peptide aggregation. Record what was observed, such as turbidity, sediment, or material adhering to a container, rather than using “precipitate” as a catch-all term. That distinction helps determine whether the next analysis should focus on soluble species, particles, or insoluble material.
Can a peptide purity result prove that a sample is aggregation-free?
No. A purity result describes what a particular analytical procedure detects and resolves; it cannot establish the absence of every aggregate form unless the method has been specifically designed and assessed for that purpose. A clean chromatographic profile, for example, cannot rule out a species that coelutes with the main peak. Keep the purity finding within its proper scope, and use an aggregation-specific measurement if the study needs evidence about aggregate status.
How can researchers distinguish fibrils from other peptide aggregates?
Use evidence that addresses both appearance and structure. Microscopy can reveal elongated, fibril-like morphology in the fields examined, while a structural probe may provide complementary evidence consistent with amyloid-like features. Neither observation alone establishes every detail of molecular structure. Include suitable controls and describe the exact signal observed; a negative dye response, for example, does not exclude aggregates that the probe is not designed to detect.
What should be included when reporting a peptide aggregation result?
Report enough detail for another researcher to understand how the signal was generated: the method principle, sample state, preparation, relevant controls, and analysis criteria. Identify whether the result concerns size, scattering, morphology, or structural response. Separate the observation from its interpretation, and state uncertainty, deviations, or disagreement between methods. This record helps readers judge whether the conclusion is supported and whether the procedure can be reproduced in their own study.
For laboratory research use only. Not for human or veterinary use. This content is educational and does not constitute medical, dosing, or usage guidance.
Browse the BLUEFIN catalog