Designing a Peptide Dose-Response Curve Experiment: A Precision Laboratory Protocol

The integrity of a potency assay rests entirely on the analytical anchor of your starting material. Even the most sophisticated four-parameter logistic model cannot compensate for unverified peptide purity or degradation during serial dilution. When designing a peptide dose-response curve experiment, researchers often face the frustration of lateral curve shifting and inconsistent IC50 values that undermine statistical significance. You understand that in high-stakes laboratory environments, precision isn't a goal; it's a requirement. Data noise is a luxury your research cannot afford.
This protocol provides the technical framework needed to master dose-response modeling with fluid precision. You'll learn to execute purity-verified reconstitution and implement advanced nonlinear regression analysis for research peptides. We'll examine a reproducible methodology for serial dilution and curve fitting while providing clear guidance on handling outliers and constraints. This guide ensures your potency measurements are analytically valid and reproducible. By the conclusion, you'll possess the confidence to transform raw data into definitive, verifiable results that withstand the rigors of professional scrutiny.
Key Takeaways
- Establish ≥99% HPLC purity as the analytical anchor to prevent X-axis shifts and ensure reproducible results.
- Master the technical nuances of designing a peptide dose-response curve experiment to generate valid potency and efficacy data.
- Utilize fluid precision in reconstitution and serial dilution protocols to minimize cumulative error across geometric series.
- Apply disciplined nonlinear regression constraints to differentiate between relative and absolute IC50/EC50 values accurately.
- Implement rigorous data-cleaning protocols to handle outliers while maintaining the academic integrity of your research model.
Fundamentals of Dose-Response Modeling in Peptide Research
The dose-response curve serves as the primary navigational chart for quantifying the interaction between a ligand and its biological target. In the context of the dose-response relationship, this visualization illustrates the sigmoidal transition from a baseline state to a maximal effect. When designing a peptide dose-response curve experiment, researchers must account for the unique biochemical profile of peptides. Their high potency and low molarity necessitate extreme precision across concentration ranges. The mathematical objective remains fixed: calculating the half-maximal effective concentration (EC50) or inhibitory concentration (IC50). These values provide the analytical anchor for comparing compound performance across different batches or molecular structures. Precision at this stage prevents the "drifting" of results that plagues less rigorous models.
The Four Parameter Logistic (4PL) Model
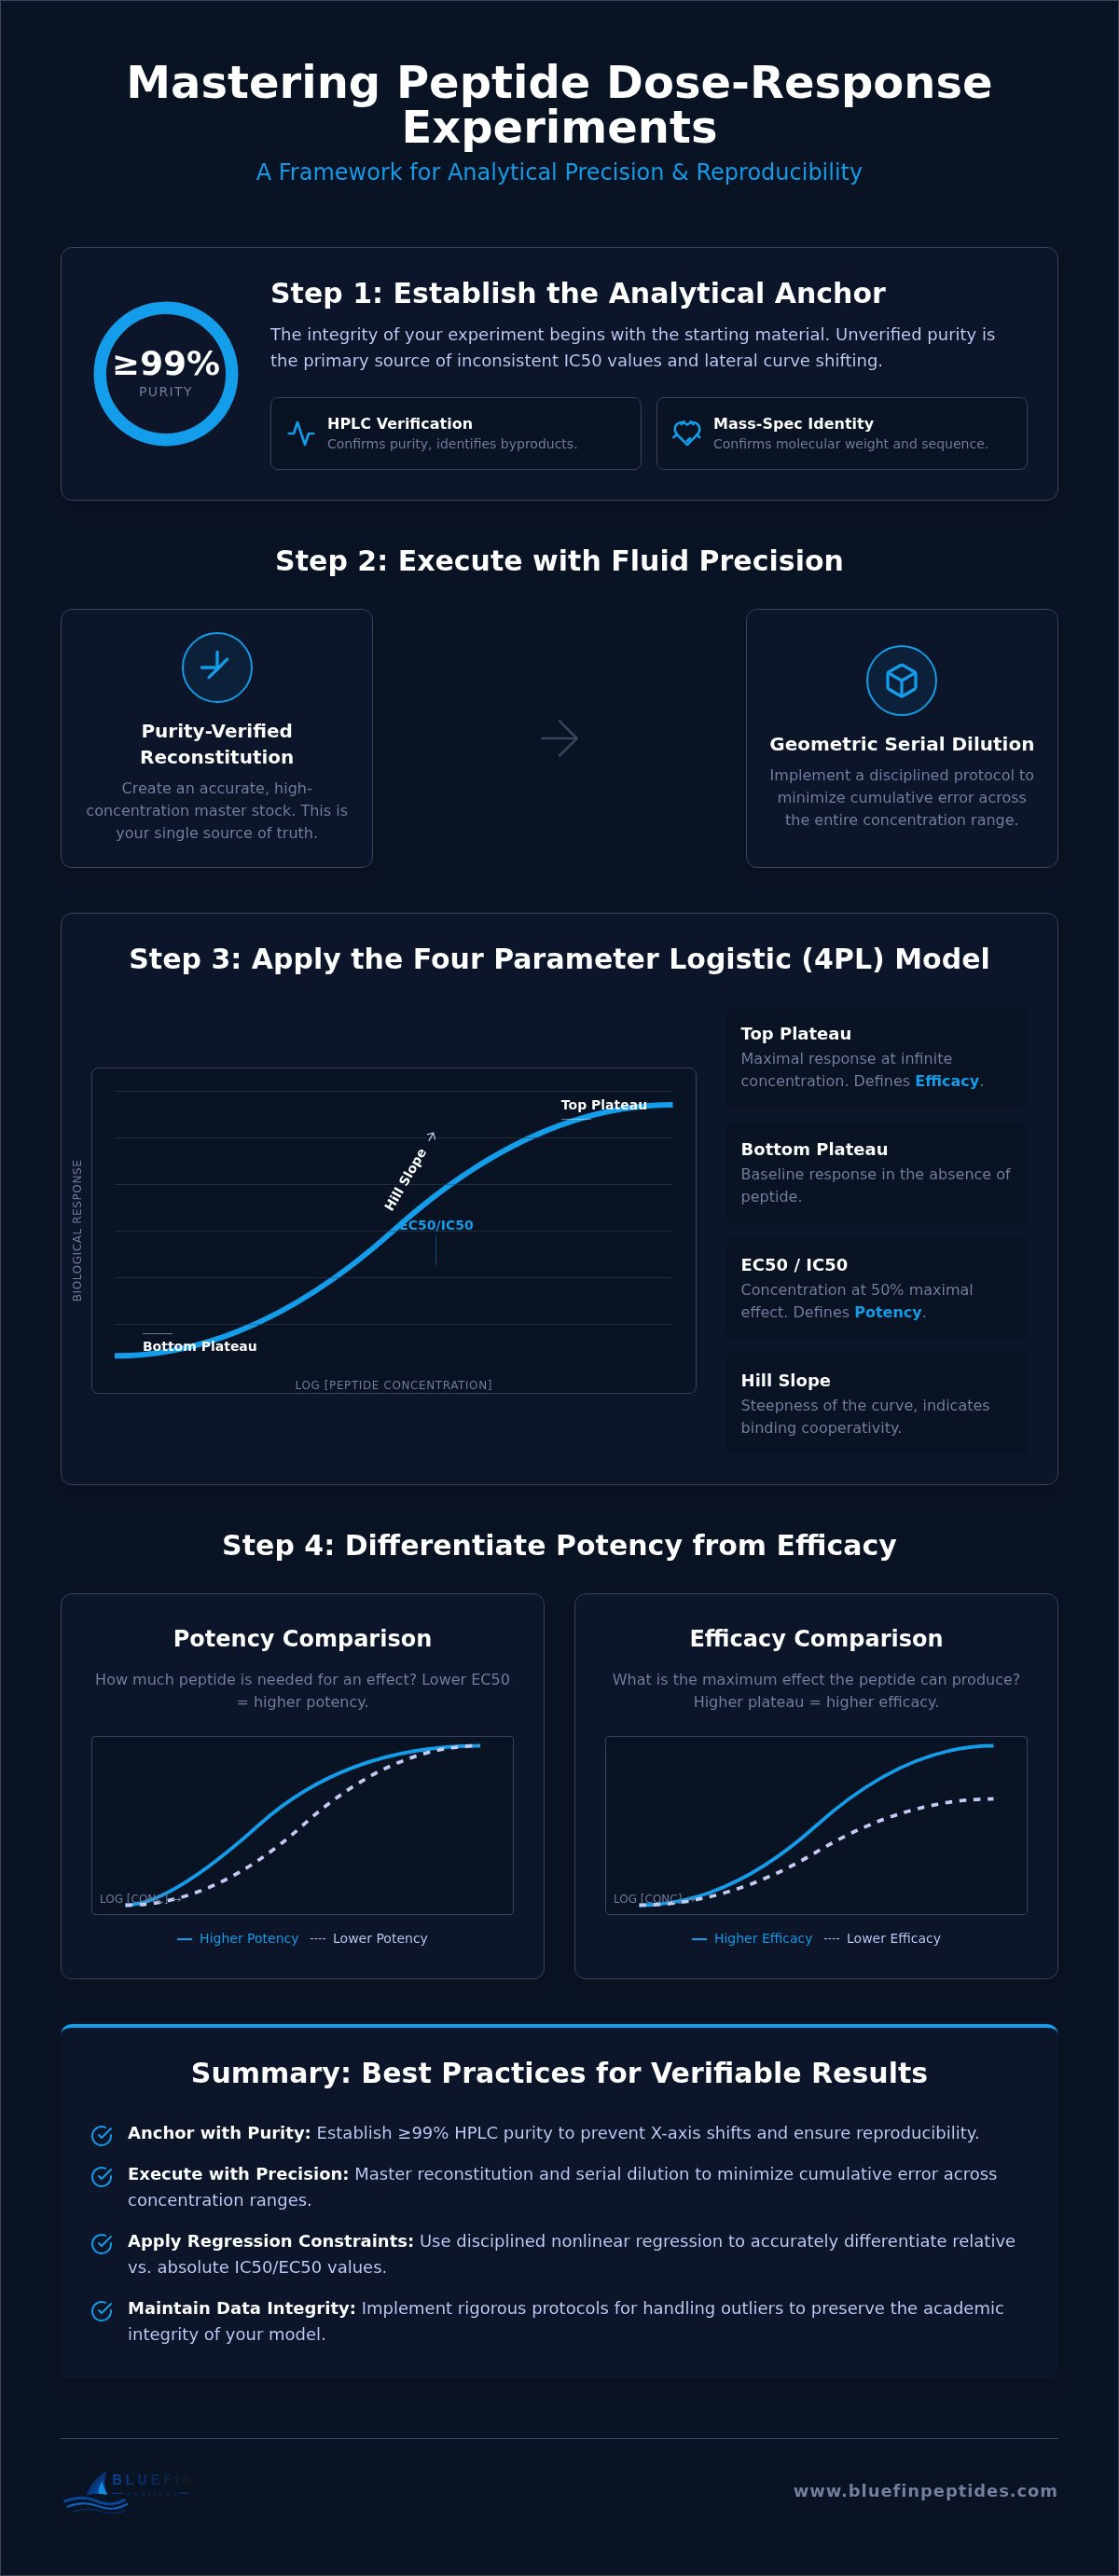
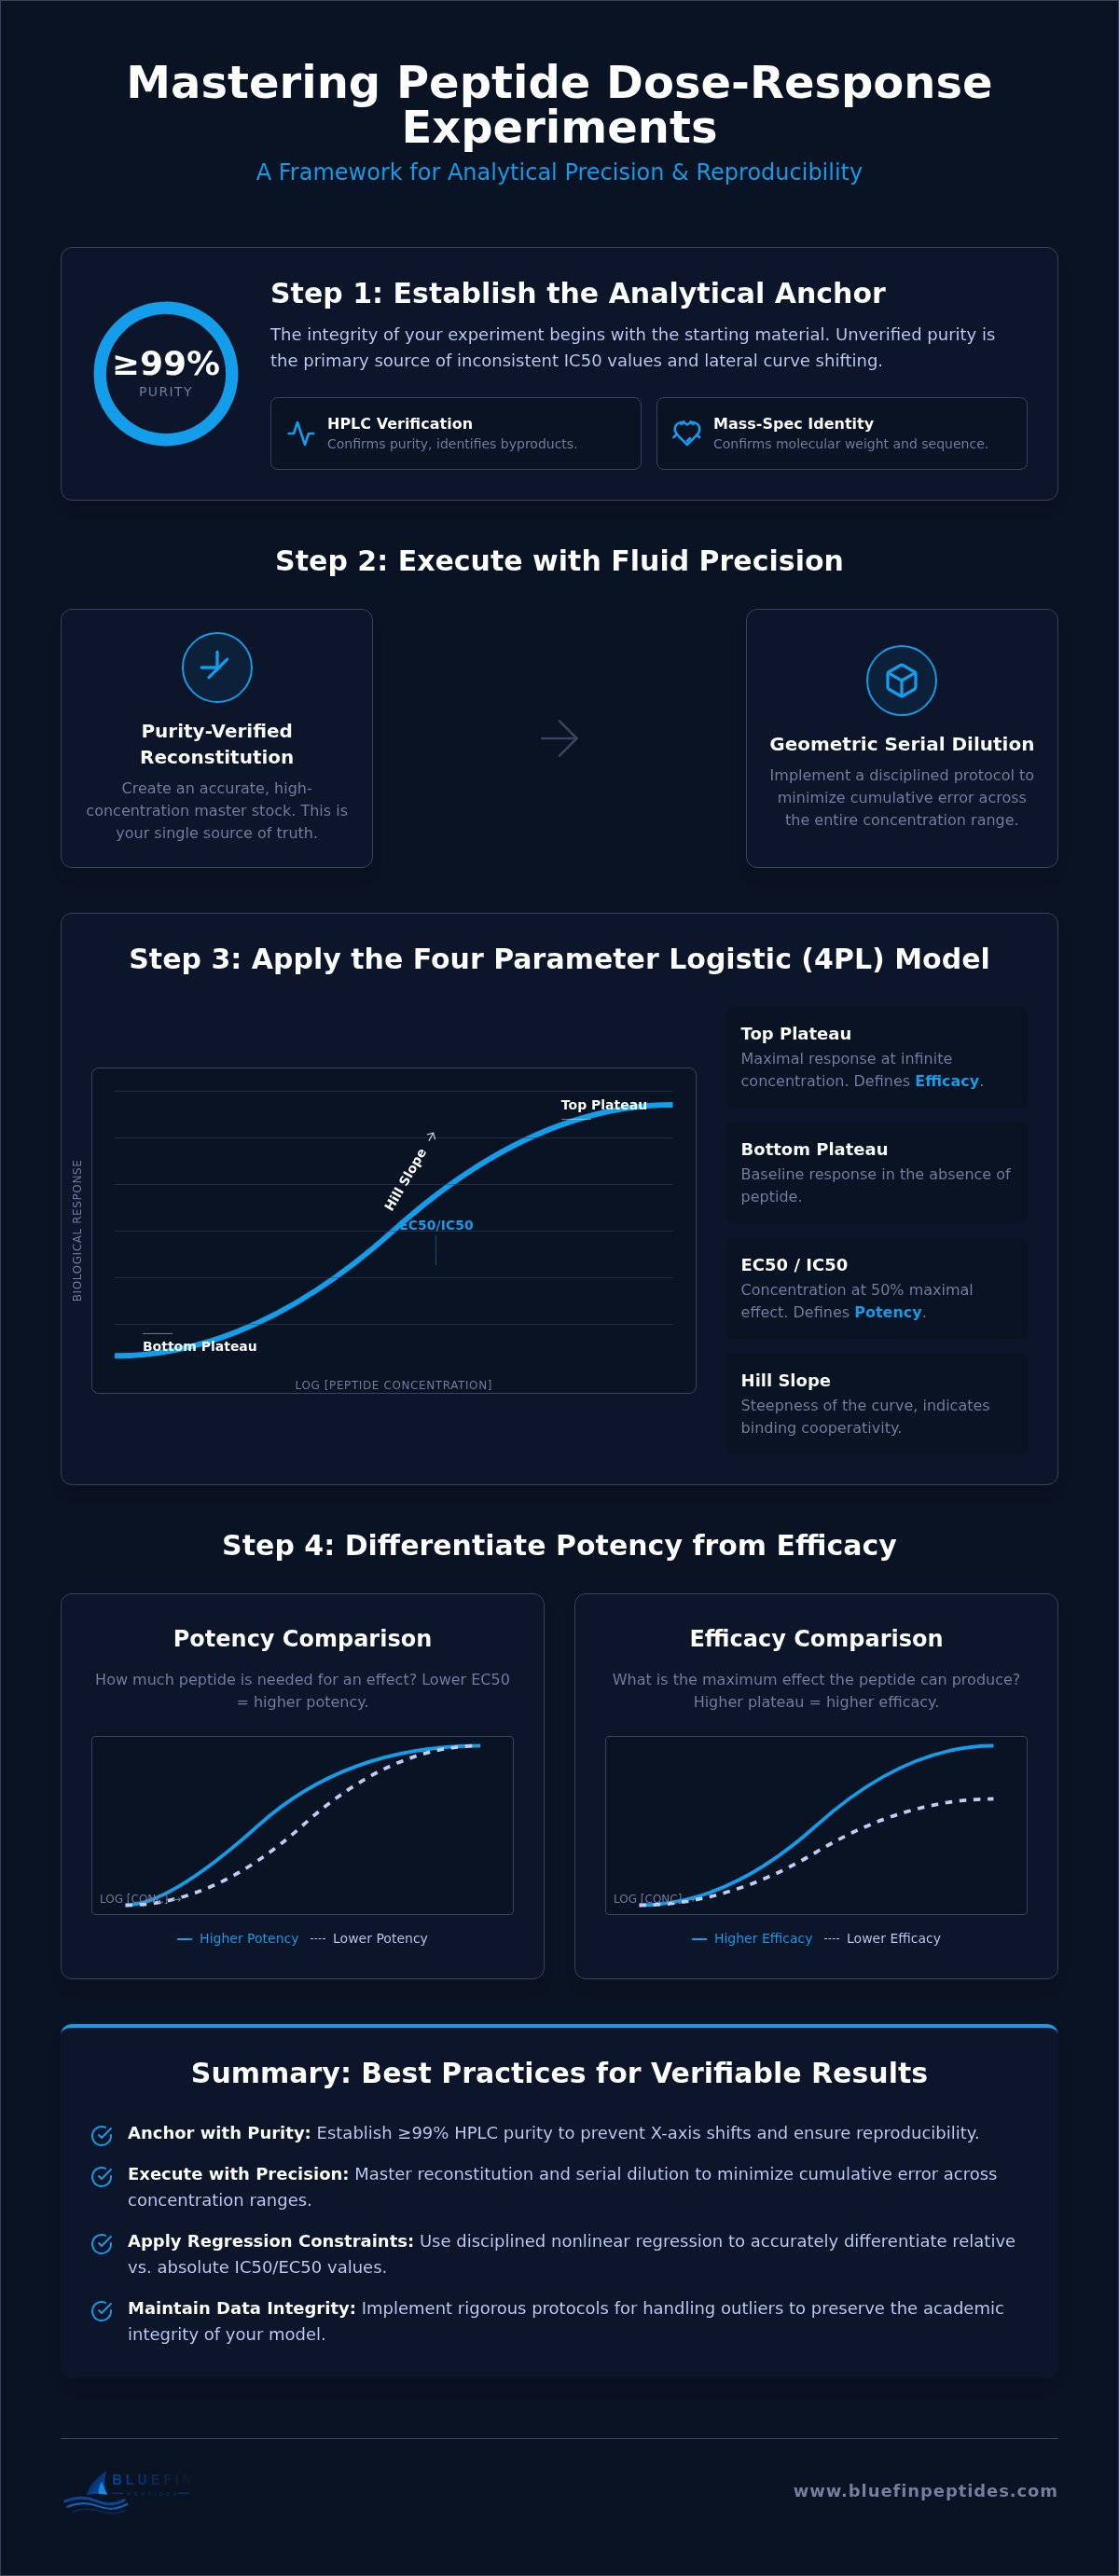
The 4PL model is the standard analytical framework for biological assays. It describes the sigmoidal curve using four distinct variables that define the physical boundaries of the experiment. The Top plateau represents the maximal response at infinite concentration. The Bottom plateau defines the baseline response in the absence of the peptide. The EC50 indicates the inflection point of the curve where the response is halfway between the two plateaus. The Hill Slope is the measure of curve steepness and binding cooperativity. This model is essential because it accommodates the inherent variability of biological systems while providing a robust statistical fit. It ensures that potency measurements aren't skewed by experimental noise or minor pipetting inaccuracies.
Identifying Potency vs. Efficacy
Distinguishing between efficacy and potency is critical for accurate data interpretation. Efficacy refers to the maximum response a peptide can elicit; it's the vertical limit of the curve. Potency describes the concentration required to reach a specific effect level, usually the EC50. When designing a peptide dose-response curve experiment for GLP-1 analogues, relative potency allows for a direct comparison between different sequences. Partial agonists introduce further complexity. They often shift the upper plateau downward despite high binding affinity. This distinction ensures that researchers don't misinterpret a high-affinity binder as a high-efficacy activator. Understanding these nuances is vital for high-performance laboratory environments where every data point must be verifiable.
Pre-Experimental Verification: Purity as a Variable Control
Analytical precision begins long before the first pipette is drawn. In designing a peptide dose-response curve experiment, ≥99% purity is a non-negotiable analytical anchor. Impurities introduce unknown variables that compromise the integrity of the sigmoidal model. By integrating research peptide quality standards into the design phase, researchers eliminate the risk of "batch drift." This phenomenon occurs when longitudinal results diverge due to inconsistent synthesis quality across different lots. Batch-specific documentation acts as the verification log for every molar calculation, ensuring that the input concentration remains a constant rather than a variable.
Utilizing HPLC and Mass-Spec to Standardize Input
High-Performance Liquid Chromatography (HPLC) provides the visual confirmation of purity required for peer-reviewed research. Researchers must scrutinize chromatograms for truncated sequences or synthesis byproducts that appear as ghost peaks. For complex GLP-1 analogues like Retatrutide, mass spectrometry serves as the definitive identity check. It confirms the exact molecular weight and amino acid sequence against the theoretical profile. Mass-spec verification eliminates the risk of testing incorrect sequences or structural isomers entirely. This level of verification is essential for high-performance laboratory environments where data noise is unacceptable.
Impact of Peptide Purity on Curve Shifting
Unverified purity levels create a hidden error in calculating the true peptide concentration. If a sample contains 5% impurities, the actual molarity is lower than the calculated value based on weight. This error shifts the X-axis of the curve, leading to significantly skewed EC50 or IC50 values. When you perform a dose-response experiment, these lateral shifts can result in "false negatives" during potency comparisons. The compound may appear less potent simply because the starting mass included non-active contaminants.
Lyophilized powders often contain residual salts and trifluoroacetic acid (TFA) from the purification process. These non-peptide components contribute to the total weight but provide zero biological activity. Without accounting for the net peptide content, your starting concentration is fundamentally flawed. High-performance laboratories rely on Bluefin Peptides to provide the batch-level transparency needed to anchor these variables. This rigorous verification prevents the drifting of dose-response curves and ensures that potency measurements are a true reflection of the peptide's biological efficacy rather than an artifact of chemical impurity.
Practical Execution: Serial Dilution and Reconstitution Strategy
Precision in designing a peptide dose-response curve experiment transcends the statistical model. It requires a disciplined approach to the physical handling of the analyte. Before any dilution occurs, the peptide must achieve total solubilization. Lyophilized cakes often require specific equilibration times to ensure full dissociation into the solvent. Incomplete dissolution creates localized concentration gradients that invalidate the entire geometric series. Researchers must also mitigate peptide loss via adsorption. Peptides are notoriously prone to "sticking" to standard polypropylene surfaces. Utilizing low-binding plastics and carrier proteins like 0.1% Bovine Serum Albumin (BSA) is critical to maintain the intended molarity. This analytical anchor ensures that the concentration in the well matches the concentration in the calculation. Nonspecific binding to labware can reduce the available peptide concentration by up to 50% in low-molarity solutions. This loss is often invisible, as the solution remains clear while the analyte adheres to the vessel walls.
Maintaining the stability window is equally vital. Once reconstituted, peptides begin a countdown toward degradation or aggregation. Thermal controls must be rigid. High-performance laboratories often follow a comprehensive protocol for dose-response experiments to standardize these environmental variables. Fluid precision is the hallmark of a professional lab. Using maritime-level accuracy in pipetting is the only way to avoid the cumulative error inherent in geometric dilutions. A minor error in the first step of a 10-point series results in a significant deviation by the final well. Calibrated instruments and consistent technique are the tools of verification.
Logarithmic vs. Geometric Spacing
Effective curve fitting requires a minimum of 7 to 10 concentrations. This range is the industry gold standard for capturing the full sigmoidal profile from baseline to plateau. Logarithmic spacing ensures an even distribution of data points across the linear portion of the curve. When designing a peptide dose-response curve experiment where the expected EC50 is known, half-log dilutions provide tighter resolution around the inflection point. This strategy allows for a more accurate calculation of the Hill Slope and binding cooperativity. It prevents data gaps that lead to ambiguous potency measurements or poor regression fits.
Stability During Multi-Point Assays
Chemical integrity must be preserved throughout the assay duration. Factors like pH and temperature significantly impact the stability of complex GLP-1 analogues. Researchers should consult peptide reconstitution research for specific solvent selection guidance to avoid premature degradation. High-concentration stock solutions must be monitored for precipitation or "crashing out" of the liquid phase. Even microscopic aggregates can alter the effective concentration, leading to inconsistent IC50 values across replicates. Stoic reliability in these processes is what separates verifiable research from anecdotal observations.
Troubleshooting and Constraining the Nonlinear Regression
Disciplined data analysis is the final filter through which raw laboratory observations become verifiable scientific data. When designing a peptide dose-response curve experiment, the choice between relative and absolute IC50 values determines the utility of the resulting model. A relative IC50 identifies the concentration at the midpoint between the observed top and bottom plateaus. This is the standard for most potency assays. However, an absolute IC50 requires the peptide to reach a predefined 50% effect level relative to a control. Normalization is the primary tool for this comparison. Converting raw Y-values to a 0–100% scale allows researchers to compare different peptide batches or analogues across multiple experiments. The model's validity is then confirmed by assessing the "Goodness of Fit" using R-squared values and narrow 95% confidence intervals. These metrics act as the analytical anchor for your statistical conclusions.
When to Constrain Plateaus and Slopes
Statistical constraints must be biologically justified. Fixing the bottom plateau to zero is appropriate when negative controls consistently demonstrate a lack of baseline activity. Similarly, constraining the Hill Slope to 1.0 assumes standard, non-cooperative binding kinetics. While this simplifies the model, allowing the slope to vary is often necessary for complex multi-site interactions common in GLP-1 research. Over-constraining is a common pitfall. It can artificially inflate R-squared values while masking underlying issues like low-purity inputs or significant pipetting error. A rigid adherence to data-driven parameters ensures the curve reflects physical reality rather than mathematical convenience.
Handling Outliers and Data Noise
Robust regression methods are essential for minimizing the influence of rogue data points without compromising academic integrity. Triplicates serve as the analytical ballast that stabilizes the sigmoidal curve against stochastic noise. If a single replicate deviates significantly, robust algorithms can down-weight its influence rather than requiring manual exclusion. Researchers must also remain vigilant for "masking" effects. At extreme concentrations, peptide-induced toxicity can mimic an inhibitory response. This creates a false upper plateau that distorts the Hill Slope and shifts the calculated EC50. Designing a peptide dose-response curve experiment with high-potency ligands requires a stoic approach to these anomalies. To ensure your model is built on a foundation of chemical precision, you must secure high-purity peptides that eliminate the noise of synthesis byproducts from the outset.
Sourcing High-Purity Compounds for Reproducible Research
Procurement is the primary phase of designing a peptide dose-response curve experiment. It defines the upper bound of analytical certainty. Without verified purity, the mathematical models discussed earlier—such as the 4PL regression—degenerate into mere approximations. Bluefin Peptides provides the analytical specifications required for peer-reviewed publication, moving beyond marketing claims to verifiable data. Logistical speed acts as a catalyst for research momentum; delays in fulfillment can lead to degradation of time-sensitive reagents. For researchers focusing on triple-agonist pathways, Retatrutide research peptide serves as the benchmark for modeling complex binding affinities and metabolic responses. Starting with a validated compound ensures that the resulting sigmoidal curve reflects the peptide's true biological potential rather than the interference of synthesis artifacts.
The Role of Batch-Specific Documentation
A generic Certificate of Analysis (COA) is insufficient for high-stakes assays. High-performance laboratories require batch-level transparency to anchor their molarity calculations. Every vial represents a specific synthesis event with its own HPLC profile and mass-spec identity. This documentation serves as a security protocol, ensuring that the peptide's chemical nature matches its theoretical sequence perfectly. Verifying lyophilized stability before reconstitution is essential. It ensures the analyte hasn't undergone hydrolysis or oxidation during storage, which would otherwise introduce artifacts into the dose-response curve. Precision in the procurement phase eliminates the variables that lead to inconsistent IC50 values and lateral curve shifting.
Bluefin Peptides: Precision Logistics for Laboratory Excellence
Bluefin maintains a commitment to ≥99% purity as the baseline for every research compound. This standard minimizes the "X-axis drift" caused by non-active impurities. Fast-paced, US-based fulfillment ensures that peptides arrive with maximum bioactivity, bypassing the degradation risks associated with prolonged international transit. When designing a peptide dose-response curve experiment, the reliability of the logistics partner is as critical as the pipetting technique. Stoic reliability in the supply chain translates to confidence in the laboratory results. You must secure the analytical anchor for your next experiment with Bluefin Peptides to ensure your data remains definitive and reproducible.
Advancing Analytical Accuracy in Peptide Assays
Successful dose-response modeling requires more than sophisticated statistical software. It demands a rigorous foundation starting with the verified chemical identity of the ligand. By prioritizing ≥99% HPLC-verified purity and mastering the technical nuances of reconstitution, you eliminate the variables that cause curve shifting and inconsistent IC50 values. Designing a peptide dose-response curve experiment is an exercise in fluid precision where every pipetting step and mathematical constraint must be biologically justified. This disciplined approach ensures that your potency measurements are an accurate reflection of biological activity rather than a byproduct of experimental noise.
To maintain this level of excellence, your laboratory requires a partner that treats quality as a non-negotiable protocol. Bluefin Peptides provides the analytical anchor necessary for peer-reviewed publication through batch-specific COAs and mass-spec confirmation. Our US-based stock and rapid shipping ensure your research doesn't lose momentum to logistical delays. Procure HPLC-Verified Peptides for Your Research and secure the integrity of your next data set. Your commitment to precision is the catalyst for definitive scientific discovery.
Frequently Asked Questions
What is the minimum number of concentrations needed for a valid dose-response curve?
A range of 7 to 10 concentrations is the industry standard for capturing a complete sigmoidal profile. This ensures sufficient coverage of the baseline, the linear portion, and the maximal plateau. Using fewer than 7 points often leads to poorly defined inflection points and wider confidence intervals. For designing a peptide dose-response curve experiment, providing enough data points allows the nonlinear regression algorithm to converge on a stable EC50 with high statistical significance.
How does peptide purity affect the calculated EC50 value?
Impurities shift the calculated concentration, leading to an inaccurate X-axis. If a peptide is only 95% pure, the effective concentration is 5% lower than the mass-based calculation. This error causes a lateral shift in the curve, resulting in an overestimation of the EC50. Utilizing ≥99% HPLC-verified peptides provides the analytical anchor required to ensure that potency measurements reflect the true biological activity of the molecule rather than synthesis byproducts.
Why should I use a 4-parameter logistic (4PL) model for peptide research?
The 4-parameter logistic model is the standard framework because it accommodates the sigmoidal nature of biological interactions. It defines the physical boundaries of the assay through the top and bottom plateaus, the Hill Slope, and the EC50. Unlike linear models, the 4PL regression accounts for the saturable nature of receptor binding. It provides a robust framework for quantifying potency while allowing for the natural variability found in high-performance laboratory environments.
Can I use the same dose-response model for both agonists and antagonists?
The 4PL model is versatile enough to characterize both agonists and antagonists effectively. For agonists, the curve typically ascends from a baseline toward a maximal response. For antagonists, the curve descends from a stimulated baseline toward a suppressed response level. The mathematical principles of the sigmoidal fit remain identical. The primary difference lies in the interpretation of the inflection point as either an EC50 for activation or an IC50 for inhibition.
What is the difference between relative and absolute IC50 in peptide assays?
Relative IC50 is the concentration at the midpoint between the observed top and bottom plateaus of your specific data set. Absolute IC50 is the concentration required to reach exactly 50% of a predefined control response. While relative IC50 is more common in early-stage designing a peptide dose-response curve experiment, absolute IC50 is necessary when comparing compounds that may not achieve a full 100% response, such as partial agonists or weak inhibitors.
How do I handle negative values or zero concentrations in a log-scale plot?
Logarithmic scales cannot plot zero or negative values because the log of zero is undefined. To include a baseline or control on a log-plot, researchers typically assign it a concentration value two log units below the lowest tested concentration. Negative response values resulting from background subtraction should be handled through normalization. Converting raw Y-values to a 0–100% scale ensures the data remains compatible with standard sigmoidal regression algorithms.
Does peptide adsorption to plastic vials impact the dose-response results?
Adsorption significantly reduces the effective concentration of the peptide in solution. Peptides often adhere to the hydrophobic surfaces of standard polypropylene labware, which lowers the amount of analyte available to interact with the target. This loss is particularly pronounced at low molarities. To prevent this, use low-binding plastics or include carrier proteins like 0.1% BSA. Failure to address adsorption leads to skewed potency measurements and poor experimental reproducibility.
When is it appropriate to constrain the Hill Slope of a curve to 1.0?
Constraining the Hill Slope to 1.0 is appropriate when the binding interaction follows standard, non-cooperative kinetics. This assumption is common in simple ligand-receptor models where one molecule binds to one site. However, if the peptide exhibits cooperativity or multiple binding sites, the slope should be allowed to vary. Constraining the slope can simplify the model and improve convergence for small data sets, but it may mask complex biological realities if over-applied.
For laboratory research use only. Not for human or veterinary use. This content is educational and does not constitute medical, dosing, or usage guidance.
Browse the BLUEFIN catalog